Main Content
Person checks stocks on phone with computer in background
Wealth Newsletter

-

Background Image
opaque image of stocks

Global Economy

.

Strong Labor Market Fuels Growth

By Ryan Lange, CFA, CAIA


SUMMARY:

The continued strength of the employment market has driven resilient consumer spending and economic growth despite higher interest rates.


OUR PERSPECTIVE:

While we expect job growth to continue to slow, the economy should remain strong as long as the size
of the total workforce remains stable. Higher labor force participation rates have offset a continued wave of retirements.


STEADY JOB GROWTH

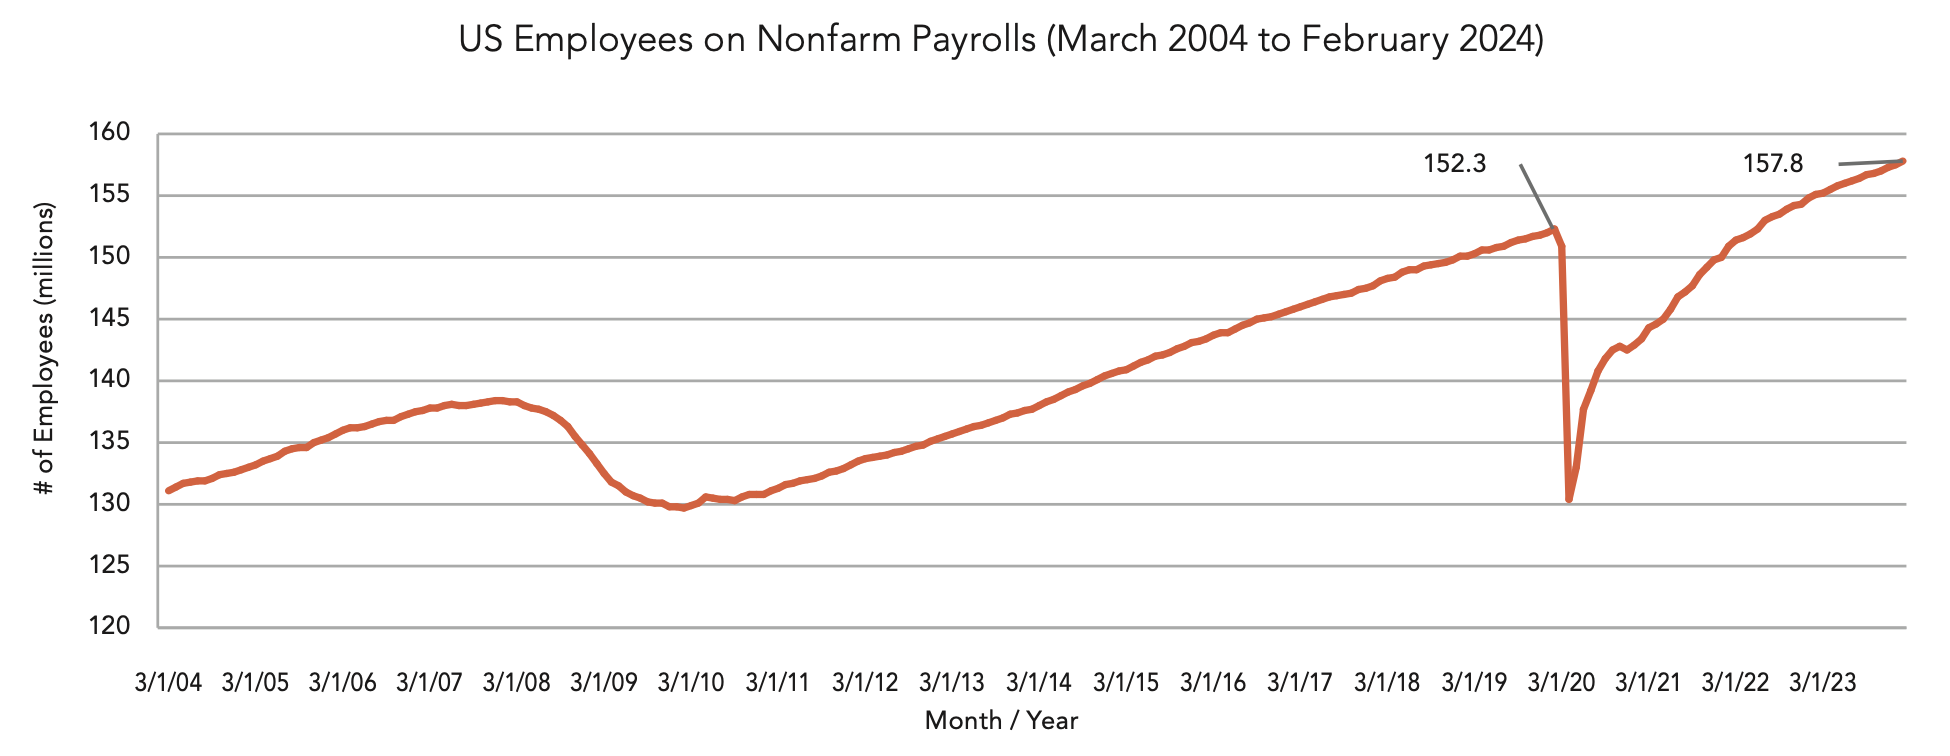
In the face of higher interest rates, the U.S. economy continues to set new records for the number of people working. This continued workforce growth is a primary driver of increased consumer spending and GDP growth. As long as the job market remains resilient, we do not see a recession in the near term.

Following a sharp rebound in the employment market post-COVID, the pace of new jobs has slowed as fewer new workers are available to enter the workforce. Even with the rate of net new payroll numbers slowing, around 3 million more people are working at the end of 2023 (157.3 million) compared to the end of 2022 (154.3 million), according to the Bureau of Labor Statistics (BLS), as highlighted in the chart below.


Nonfarm Payrolls Graph


THE STRONG U.S. CONSUMER

More people working and higher wages continue to boost consumer spending. While this increased spending is a driver of higher inflation, it is also important to note that consumer spending makes up more than two-thirds of U.S. GDP. It continues to be a balancing act for the Federal Reserve (Fed) to reduce inflation while not adversely impacting the job market – which they have so far managed successfully. An early warning sign of an upcoming recession would be net job losses leading to reduced consumer spending.

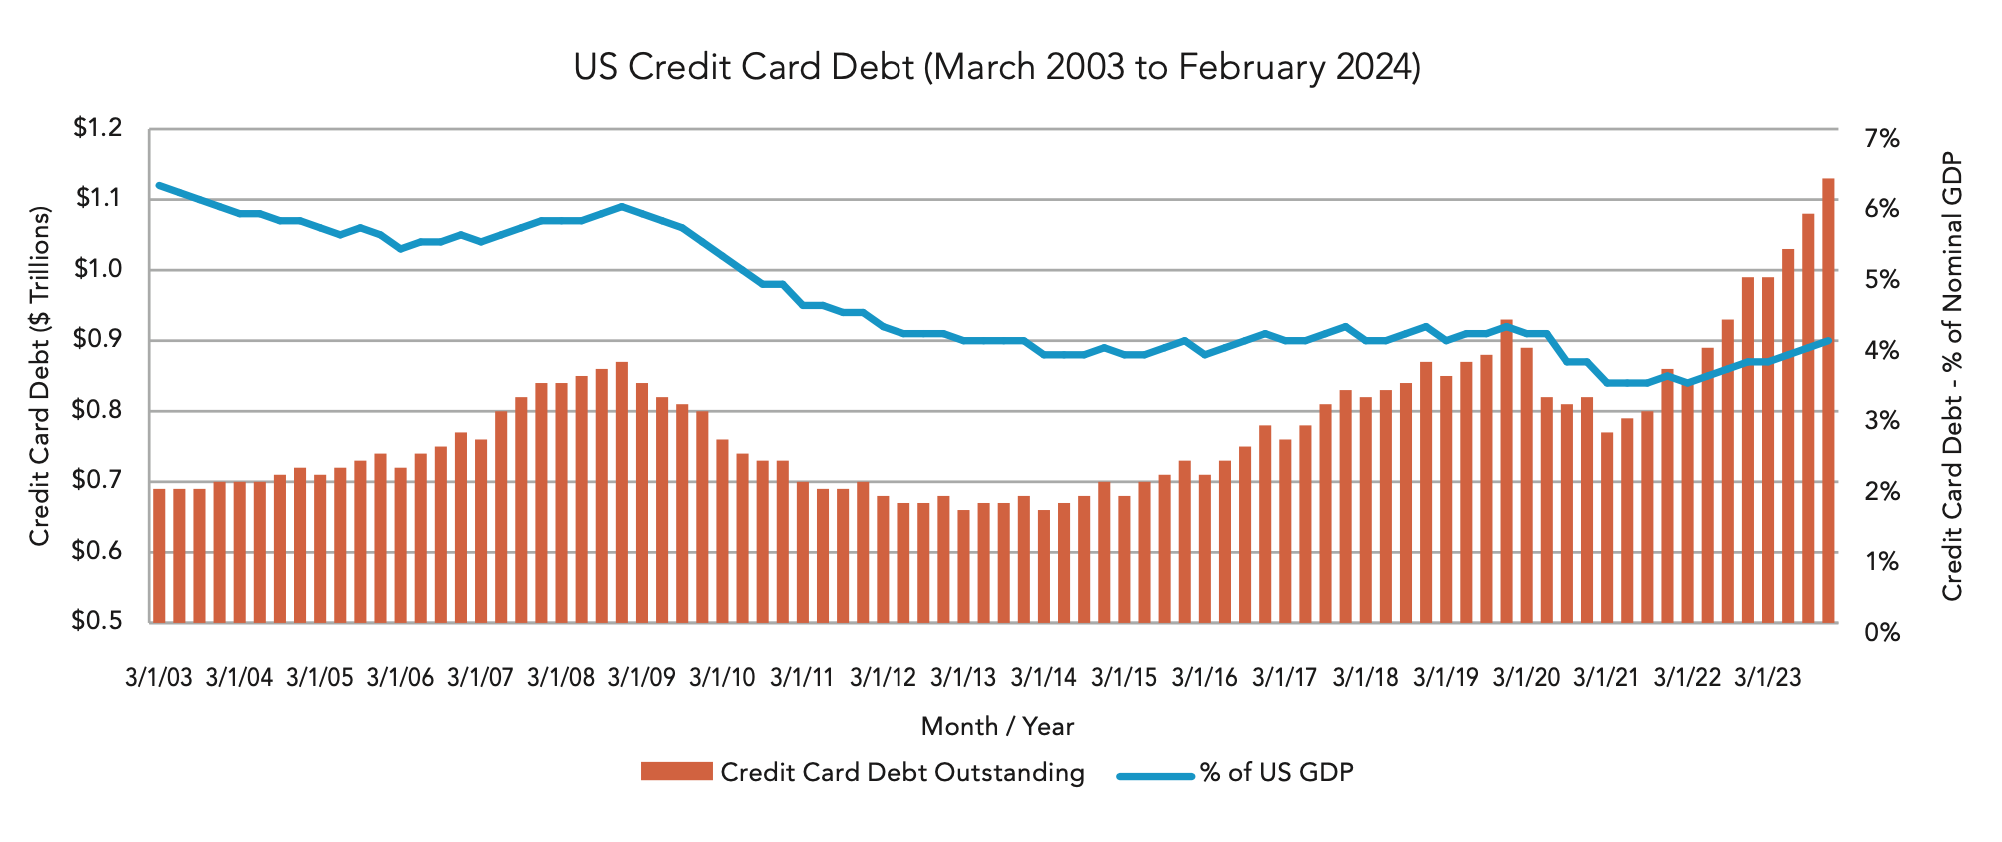
Multiple news stories raised alarm bells over the rapidly increasing credit card debt balances. Despite the negative impact of higher inflation levels, we do not yet view the level of outstanding credit card balances as a warning sign. The size of the debt is large ($1.13 trillion as of the end of 2023) and has increased sharply over the past couple of years, as highlighted in the chart below (orange bars), but it is better to look at those balances relative to the size of the U.S. economy (blue line). In aggregate, U.S. consumers have been deleveraging their balance sheets for most of the past 20 years. When adjusting the outstanding credit card balances as a percentage of the size of the economy, we are back to around the 4% level that we last saw in mid-2020, which remains much lower than most of the past 20 years. While the amount of consumer debt may become an issue that impacts economic growth at some point, we do not yet believe that the current level is cause for concern.


MORE PEOPLE WORKING AND HIGHER WAGES CONTINUE TO BOOST CONSUMER SPENDING.


US Credit Card Debt Graph


Back to Top

Background Image
upclose shot of US treasure building

Fixed Income

.

Delayed Rate Cuts

By Jake Stapleton


SUMMARY:

Persistent inflation and a resilient U.S. consumer have pushed back expectations for the first rate cut.


OUR PERSPECTIVE:

Rather than fixating solely on when the rate cut might occur, it’s crucial to understand the rationale behind rate cuts and their potential path lower.


THE ELUSIVE RATE CUT

Initial forecasts for the Fed to commence reducing interest rates at either their March or May meetings of 2024 have been recalibrated due to robust U.S. consumer activity and enduring inflationary pressures. Why is so much emphasis on reducing interest rates if the economy remains strong? The Fed’s mandate includes maintaining a balanced job market alongside stable inflation around 2%. Over the past year, these metrics have continued to move closer to those targets. The unemployment rate has continued to hover between 3.5% and 4.0%, below the 30-year average of 5.6%. Inflation has decreased from 5.2% in February 2023 to 2.5% in February 2024 as measured by the Personal Consumption Expenditure (PCE) Index, the preferred inflation index that the Fed monitors.

One compelling reason for an early rate cut could be to prevent an economic downturn by avoiding prolonged restrictive policies. Historically, rate cuts tend to follow when the fed funds rate surpasses inflation measures, as observed in previous cycles. The chart below highlights the growing gap between short-term interest rates and inflation.


PCE Index vs Effective Fed Funds Rate Graph


NOT ALL RATES ARE CREATED EQUAL

Focusing on interest rates helps to step back and clarify which interest rate is under discussion. Like there is no single equity market, there is no single interest rate. When allocating to fixed income within portfolios, we take a diversified approach across time horizons (short, intermediate, long)
and exposure to various creditors (government, municipal, corporate, mortgage, among others). The impact of Fed policy rates varies across different segments of the fixed income market. Short-term government rates (i.e., two years or less) are the most impacted by changes in the policy rate set by the Fed. Conversely, long-term rate (greater than ten years) are far more affected by longer-term
inflationary expectations.

When rates begin to fall, we typically do not see an equal-size drop in 10-year U.S. Treasury (UST) yields. For those waiting for mortgage rates to drop, it is worth noting that most mortgages are impacted more by changes in the 10-year UST rate than by short-term rates over which the Fed has more control.


THE FED’S MANDATE INCLUDES MAINTAINING A BALANCED JOB MARKET ALONGSIDE STABLE INFLATION...


LESS VALUE IN MUNICIPAL BONDS

Investors, particularly those in taxable accounts, should monitor the dynamics between taxable and tax-exempt bonds. Despite the potential tax benefits of municipal bonds for high-bracket taxpayers, the current yield gap between

USTs and municipal bonds might favor taxable bonds. Consequently, adjusting fixed income exposure to reflect after-tax returns becomes crucial, considering the prevailing interest rate environment.

If we look at yields at the end of March, 10-year USTs were around 4.2%, while 10-year AAA general obligation tax-exempt municipal levels were around 2.5%. Even investors in the top federal tax bracket of 37% would see higher after-tax rates of returns by holding USTs. Highlighted in the chart below, the gap between 10-year UST and AAA municipal yields is much higher than usual, leading to an unfavorable environment for those municipal bonds.

Given the evolving interest rate landscape, holding individual bonds until maturity can limit flexibility. Maintaining a diversified approach allows investors to capitalize on market opportunities while mitigating liquidity risks associated with individual bond holdings. As such, minimizing municipal bond exposure and adopting a flexible fixed income strategy are recommended in the current environment.


Treasury Yield vs Municipal Yield Graph


Back to Top

Background Image
upclose shot of wall street sign

Equity Markets

.

The Road More or Less Traveled

By Mark Votruba


SUMMARY:

The market strength of 2023, led primarily by mega- cap technology issues, carried forward into Q1 as the S&P 500 index posted an impressive 10.5% gain to end the quarter.


OUR PERSPECTIVE:

We remain positive on equities following the first-quarter rally. A strong labor market and corresponding consumer spending have supported continued economic growth. The outlook for corporate earnings continues to trend higher, with mid-to-high single-digit growth expected for 2024. However, we recognize the possibility of near-term volatility following the YTD market rally as we look forward to what should be a dynamic 2024.


NARROW PATH AHEAD?

U.S. equities are up meaningfully from the October 2023 lows, driven by expectations of easing monetary policy as telegraphed by the Federal Open Market Committee (FOMC) late last year. Strength in mega-cap technology issues has been a significant driver of market returns and remained the case for the first quarter. The concentration among the top 10 holdings, a majority being tech- related issues, accounts for approximately 34% of the total market capitalization of the S&P 500 index. These constituents alone outperformed the entire index by 2.1% during Q1. The narrow market leadership and concentration to return have raised questions surrounding the near-term sustainability of recent market strength. Valuations, particularly among the top constituents of the S&P 500, are currently above historical averages, indicating that investor optimism may be getting ahead of itself. The remaining stocks are valued much closer to historical averages, although still at a premium, but have not participated in the YTD market rally to the same degree. We see signs of a broadening market, with the month-over-month return disparity narrowing. The Fed’s pivot to easing monetary policy and expectations of rate cuts in late 2023 helped spark a broader rally in stocks as underinvested market areas began to catch up. As it became clear that the anticipated cuts would likely be fewer and to a lesser degree than initially thought, market leadership again narrowed, with the top 10 holdings outperforming the broader index for the first two months of the quarter. However, this dynamic slowed in March, as the broad index outperformed the top 10 holdings for the month. The positive implications of increased market breadth will depend on the continued moderation of inflationary conditions, coupled with sustained economic growth and steady corporate earnings growth going forward.


Month Over Month Returns Graph


THE LONG ROAD BACK

The YTD rally was not limited to domestic large- cap issues. Japanese stocks have seen a fresh wave of global investment, with the Nikkei 225 index finally exceeding its previous highs set 34 years ago. Like the U.S. equity markets, the rally into
2024 was characterized by higher concentration levels, particularly among large-cap issues and semiconductors. Structural initiatives in Japan have encouraged companies to increase their efforts to improve capital efficiency. Improved stewardship
of capital saw share repurchases reach the highest level on record in 2023, helping to drive Nikkei higher. These initiatives, coupled with the shift to a once again inflationary economy, continue to attract foreign investment. Japan has finally emerged from a decades-long deflationary macro environment, which has seen price increases translate to wage growth, leading to increased consumer spending and creating a tailwind for the economy. Although valuations for Japanese equities have increased, they remain reasonable, with the potential to re-rate higher, strengthening the case for further diversification outside of core domestic markets.


Nikkei 225 Index Graph


Back to Top