



Summary:
The S&P 500 remains near-record, but recent gains have not been evenly distributed. The S&P 500 Equal Weight Index and the median S&P constituent performance show a weaker broad market beneath the headline index. This divergence helps explain the resilience of the S&P 500 index in the face of multiple headwinds.
Want a broader view of this quarter’s trends? Download the full market outlook for insights across equity, fixed income, and private markets.
Our Perspective
Despite narrowing breadth and macroeconomic headwinds, we remain constructive on equities as earnings continue to grow. A highly concentrated index, however, requires greater attention to what drives returns and the extent to which portfolio risk depends on a small number of companies.
The Index Is Not the Average Stock
At the September 30 close, the S&P 500 was only 2.4% below its all-time high, which it would hit six days later. Looking at the index level, the market appears strong. Yet when we look at the companies that comprise the S&P 500, the divergence between the index and companies driving returns is striking.
It is important to understand how the S&P 500 is constructed. Like many indexes, the S&P 500 is weighted by market capitalization. The larger the company’s total market value, the greater its influence on the index. Market capitalization-weighted indexes are common because they represent the investable market and naturally adjust as companies grow or decline in value. The trade-off is that a small number of large companies can outweigh hundreds of smaller ones.
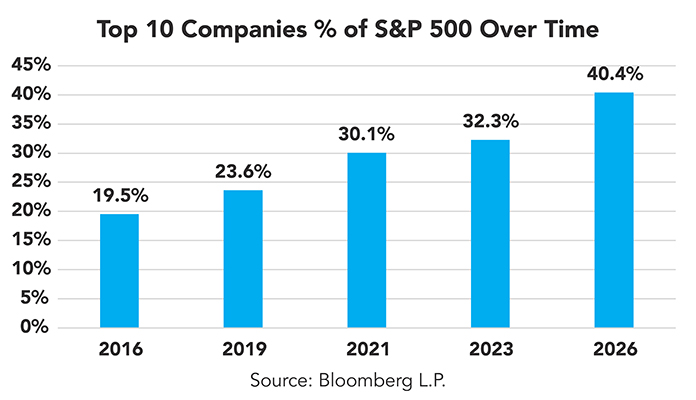
Over the past ten years, the S&P 500 has been increasingly influenced by the top ten companies. At quarter-end, the ten largest S&P 500 companies accounted for approximately 40.4% of the index, up from 19.5% ten years ago. When these companies perform well, they can drive the benchmark higher even as larger parts of the market struggle.
Equal-Weight and the Median Return Tell a Different Story
The equal-weight S&P 500 provides a useful comparison. It owns the same companies as the traditional index but assigns each company an approximate 0.2% weight at every quarterly rebalance, making it a good gauge of breadth. Year to date through September 30, including reinvested dividends, the S&P 500 returned 12.7%, compared with 10.0% for equal-weight. Over the latest quarter, the S&P 500 gained 2.3%, while the equal-weight declined 4.2%.
The median constituent tells a similar story. Because the median cannot be pulled higher by a few exceptionally strong companies, it provides a more direct view of the typical stock. Over the latest quarter, the median S&P 500 company declined 5.3%, and only 25% of constituents generated a positive return in September.
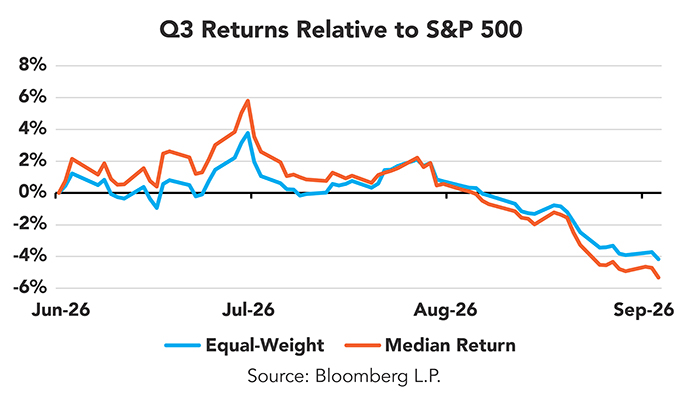
Equal-weight and the median return are not perfect measures of market health. Equal-weight places more emphasis on smaller companies and changes the index’s sector composition; median is a measure of central tendency designed to remove the emphasis of outliers. Still, when both trail the capitalization-weighted index by a wide margin, the conclusion is clear: recent gains have been heavily concentrated in the S&P 500.
A Market Out of Breadth
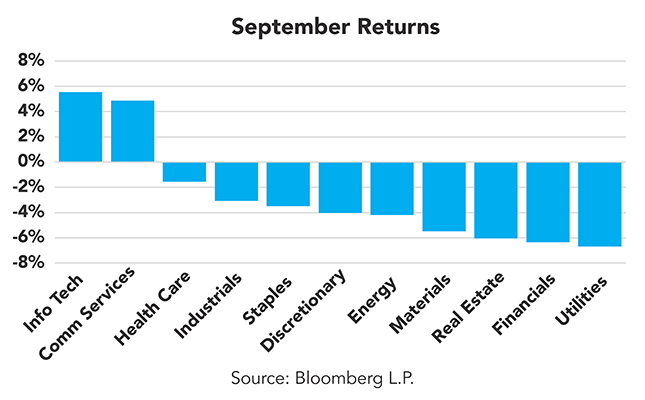
Market breadth measures how widely gains and losses are distributed across the companies and sectors that make up an index. The equal-weight and median return data show that participation narrowed during the quarter. The sector picture helps explain why.
The Artificial Intelligence (AI) infrastructure buildout remains the market’s most powerful return driver. The theme is not limited to large technology platforms but extends to semiconductor manufacturers, memory providers, networking companies, electrical equipment, power generation, cooling systems, and data-center operators.
While the AI buildout has broadened across industries, it has not, however, produced equally broad strength across the market. Many of the companies and sectors leading the S&P 500 remain connected to the investment in AI infrastructure.
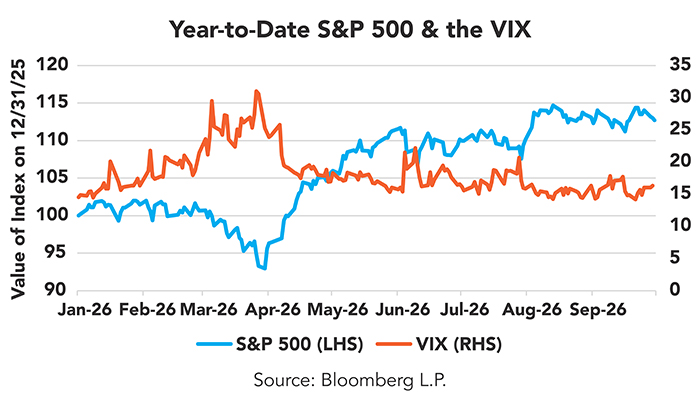
That fundamental support from the AI theme, which elevates the largest constituents in the index, helps explain why volatility has remained low and why investors have continued to look through the macroeconomic headwinds of rising rates, higher energy costs, and geopolitical uncertainty. We can visualize this using the VIX index, a measure of expected volatility for the S&P 500. Low index volatility, coupled with strong returns and low breadth, can give the appearance of market stability.
Portfolio Construction in a Narrow Market
Narrow breadth does not tell us to divest from the market’s leaders. Many of the largest companies remain among the market’s strongest businesses and are central to the AI infrastructure buildout. Being underexposed can create its own risk if those companies continue to drive earnings and index returns.
At the same time, allowing them to dominate a portfolio can leave investors overly dependent on a narrow group of companies and a single underlying investment theme, thereby increasing overall portfolio risk.
Our objective is to balance those two risks by maintaining enough exposure to participate if today’s leaders continue to perform, but not so much that portfolio outcomes depend on them continuing to lead indefinitely. Position sizing and rebalancing help maintain that balance as market weights and valuations change.
We begin that process by understanding what we actually own. We review the underlying holdings of our strategies to identify overlap among companies and the economic forces driving returns. Therefore, rather than evaluating each investment in isolation, we consider its role in the portfolio as a whole.
Some investments provide exposure to current market leadership, others add income, liquidity, downside resilience, or different return drivers. Our goal is not to own every category, but to participate in market growth without depending too heavily on any one company, theme, or economic outcome. Breadth does not predict where markets go next, but it helps us balance exposure to today’s leaders with preparation for what may follow.
Balancing exposure to today's market leaders with thoughtful diversification can help prepare portfolios for what may come next. Connect with a Midland Wealth Advisor.
Past performance is no guarantee of future results. Investing involves risk, including possible loss of principal. Diversification and asset allocation do not ensure a profit or protect against loss.
Market indices are unmanaged and are presented for informational and comparative purposes only. Index returns do not represent the performance of an actual investment account and generally do not reflect investment management fees, transaction costs or other expenses. It is not possible to invest directly in an index.


