


Summary:
With mega-cap technology stocks driving a substantial share of equity market returns in recent years and many mid- to small-cap companies struggling to keep pace in earnings growth, our team is introducing new equity themes designed to broaden selective technology exposure and add a natural resource allocation. These adjustments aim to enhance portfolio balance and improve diversification amid an evolving market landscape.
Want a broader view of this quarter’s trends? Download the full market outlook for insights across the economy, equity, and private markets.
Our Perspective:
As companies pour massive resources into building the infrastructure behind artificial intelligence (AI), some investors are starting to wonder whether big tech firms will be able to translate these investments into sustained long-term profits.
AI Infrastructure Spending
The legacy business models of major technology firms are evolving as competition intensifies in the race to build out artificial intelligence infrastructure. Companies such as Meta (Facebook), Google, Microsoft, and Amazon are significantly expanding their capital expenditure budgets to develop massive data centers dedicated to AI. While these firms have achieved remarkable revenue and earnings growth under their traditional models, it remains too early to tell whether their new AI-driven investments will deliver comparable profitability. The chart below highlights the amount of capital expenditures (Cap-Ex) from those four companies, showing how much it has increased recently.
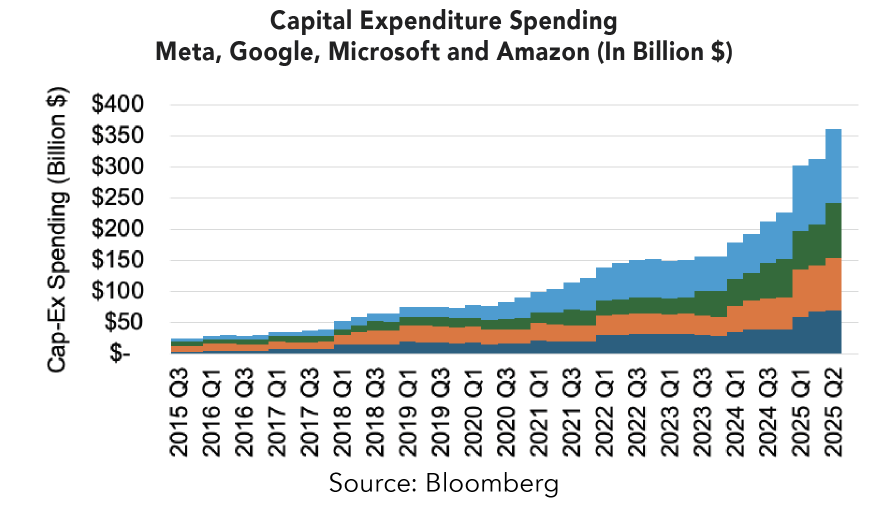
Following an extraordinary 10–15-year rally in these mega-cap tech stocks, our team views this as an opportune time to take some profits and reallocate toward areas that stand to benefit from the next phase of the AI buildout. It’s not to say that there is no more room for these large tech firms to continue to rally, but our focus is more on risk management and new emerging opportunities.
Next Generation of Innovation
While much of the market’s attention remains on artificial intelligence, investors may be underestimating the potential of other emerging technologies that could unlock new opportunities. The accelerating pace of change in the global economy continues to separate companies that lead in innovation from those struggling to keep pace. From an investment standpoint, identifying the firms best positioned to benefit from these shifts is increasingly complex. To gain broad exposure to this evolving landscape, our team recently allocated to an ETF that tracks the S&P Kensho New Economies Index, providing a diversified, index-based approach to capturing innovation-driven growth.
This index identifies key themes in the early stages of the Fourth Industrial Revolution and the publicly traded companies best positioned to benefit from them. Many of these areas are expected to be highly disruptive to traditional business models, though it remains too early to determine which companies will emerge as long-term winners. Because profitability for many of these firms may still be years away, their valuations tend to be sensitive to interest rate movements. As bond yields decline, the present value of those future cash flows increases—a dynamic that helped drive a strong rally in this index during 2020-2021, before those gains reversed as rates rose sharply. With the current level of interest rates, this may create a great entry point to this allocation.
A summary of the key subsectors of this index.
- Space
- Robotics
- Clean Energy
- Cyber Security
- Smart Borders
- Wearables
- Drones
- Clean Tech
- Virtual Reality
- Smart Buildings
- Autonomous Vehicles
- Digital Communities
- Enterprise Collaboration
- Sustainable Farming
- Genetic Engineering
- 3D Printing
- Nanotechnology
- Smart Factories
- Smart Grids
- Advanced Transport Systems
- Electric Vehicles
- Alternative Financing
- Future Payments
- Distributed Ledger
- Digital Health
Investing in emerging themes can be challenging because not every company will become a long-term winner. Yet the few that succeed often deliver extraordinary returns that more than offset the losses of others. This pattern has been evident within the S&P Kensho New Economies Index from December 2018 through September 2025. While the index rose by approximately 150% during that period, the median stock actually declined slightly (–0.5%). The gains were driven by a small group of standout performers—seven stocks with returns exceeding 1,000%, creating a strong positive skew in results. As the chart below illustrates, this dynamic highlights how capturing even a few of these breakthrough successes can have a meaningful impact on overall portfolio performance.

Balancing Growth and Value with Natural Resource Exposure
As valuations across the broader US equity market continue to climb—driven in part by enthusiasm surrounding artificial intelligence—other segments of the market still offer compelling opportunities. The S&P 500’s forward price-to-earnings (P/E) ratio ended the third quarter near 25x, well above its 25-year average of approximately 18x.
In contrast, natural resource equities are trading near historically wide valuation discounts relative to the S&P 500, as shown in the chart below. This discount presents a potential opportunity: if valuations revert closer to their long-term averages, the sector could experience a meaningful period of relative outperformance.
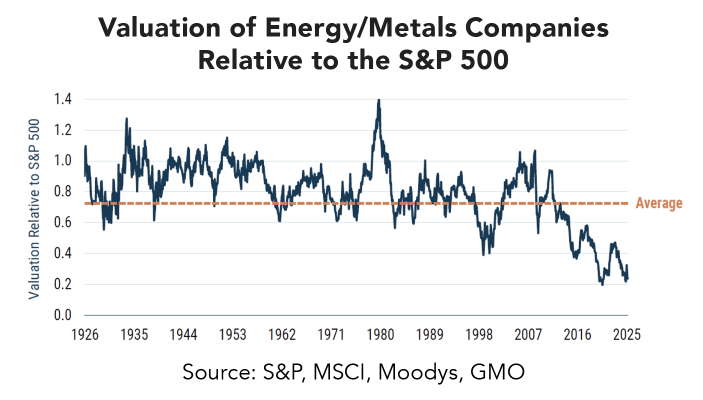
Beyond valuation considerations, the natural resources allocation also provides a potential hedge against US dollar weakness. Because most commodities are priced globally, they tend to benefit when the dollar declines in value. With increasing global discussion around alternatives to the US dollar as the primary reserve currency, this exposure can serve as a useful diversifier in the event of a prolonged period of relative dollar weakness.
Another key advantage within this segment is the high dispersion of returns between individual commodities and the equities tied to them. This variability creates meaningful opportunities for skilled active managers to add value through selective positioning. While index-based strategies remain effective in many areas of equity exposure, our team believes that active management can play an important role within natural resources, given the complexity and volatility of the underlying markets.
As markets evolve, so should your portfolio. Connect with a Midland Wealth Advisor to explore opportunities in innovation, diversification, and long-term growth.