Market Outlook Newsletter 4th Quarter 2024
The US labor market seems to be softening, but longterm trends indicate post-pandemic normalization.
We remain neutral on the labor market, viewing recent changes as normalization, but will continue monitoring for further development.
In August, the Bureau of Labor Statistics (BLS) significantly revised job creation numbers in its annual benchmark update, reporting 818,000 fewer jobs than originally estimated between April 2023 and March 2024. Initially, the BLS announced that 2.9 million jobs had been created during that period, but this figure was revised down by almost 30%. The largest downward adjustments were in professional business services, with a reduction of 358,000 jobs, and in leisure and hospitality, with a cut of 150,000 jobs.
While we haven’t seen downward revisions of this scale since 2009, they should be viewed in the context of the overall labor market. With over 161 million nonfarm workers in the US, this job creation markdown is relatively small, especially given the broader trend of positive net job creation. The economy has added an average of 197,000 jobs per month over the past year, well above the 20- year average of 112,000. Even with the latest (prerevised) figure of 142,000, job growth remains solid.
The nature of these revisions underscores the limitations of the data collection process more so than the overall health of the labor market. The BLS surveys 60,000 households and 122,000 businesses, which provides a robust sample but is still subject to adjustments. Initial estimates are often based on incomplete data, leading to upward or downward revisions. In this case, the significant markdown created confusion, but other sectors, like private education/health services, saw upward revisions of 87,000 jobs. While any downward adjustments aren’t inherently positive, we believe they reflect a trend towards historical norms more than anything else.
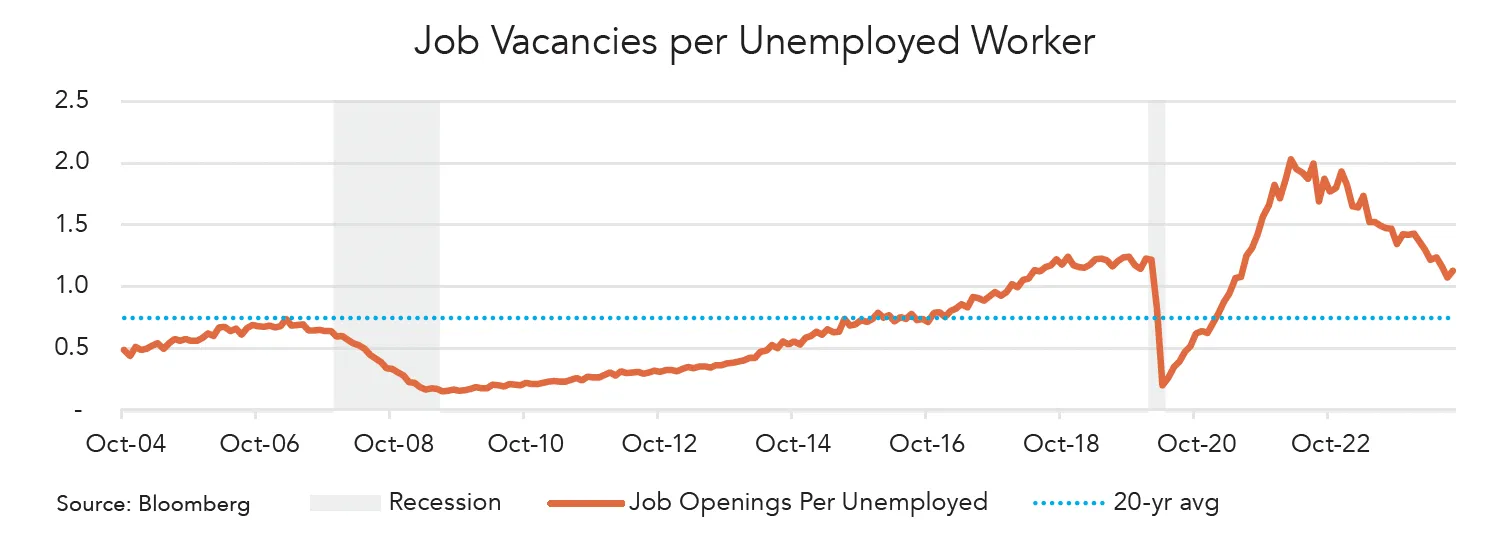
Job creation is just one aspect of the broader labor market. A useful measure for understanding the employment landscape is the ratio between job vacancies and the number of unemployed individuals. A job vacancy refers to a position that an employer is actively seeking to fill within 30 days, excluding internal or temporary hires. Meanwhile, unemployment measures those seeking work for more than four weeks and are available to start.
Historically, the ratio has averaged around 0.75 job vacancies per unemployed person over the past 20 years, including recessions. Following the pandemic disruptions, the ratio peaked at 2.0 in 2022 and has since fallen to 1.13. At first glance, this decline may seem alarming, but it primarily reflects a mean reversion after the volatile swings of the COVID era. Unemployment spiked from 3.5% to 14.8% in the early months of the pandemic, and the “Great Resignation” caused a surge in job vacancies from 2021 to the end of 2023. Much of the recent downward movement in job vacancy rates is simply a correction from the extraordinary post-COVID conditions.
Though we have experienced a slowdown in job growth, we don’t believe it is of significant 3 concern now. The ratio is still above historical averages, suggesting that demand for labor remains relatively strong. Investors should recognize that much of the current trend reflects a rebalancing rather than a sign of widespread weakness.
Despite the overall healthy labor market, some sectors, particularly manufacturing, feel contractionary pressures. The Institute for Supply Management (ISM) Manufacturing Index tracks the sector’s health through indicators like new orders, production, employment, deliveries, and inventories. A reading below 50.0 is contractionary, and above 50.0 is expansionary; the most recent reading was 47.2 for the month of September. This marks the 22nd contractionary month in the past 24 months, with manufacturing employment contracting for the last four consecutive months. Out of the 18 industries surveyed, only two reported job growth.
This weakness in manufacturing is part of a broader pattern of “rolling recessions,” where specific sectors face downturns while others continue to grow. The tech industry experienced similar contractionary pressures in 2022 and 2023, and now manufacturing is seeing its share of the challenges. However, manufacturing accounts for only 10-15% of US GDP, whereas services contribute nearly 80%. Fortunately, the ISM Services Index remains above the 50-point threshold, indicating expansion and employment in the services sector continues to grow, albeit at a slower pace.
This sectoral disparity highlights the resilience of the US labor market. While manufacturing faces challenges, the services sector remains robust, which is far more significant to the economy. This strength in services helps mitigate the impact of the manufacturing slowdown, suggesting that while the labor market is softening in some areas, the overall outlook remains stable.

The equity market rally extended beyond US largecap equities in the third quarter.
Small-cap and international equities outperformed. Within US large cap, performance shifted away from technology as utilities and real estate significantly outperformed.
In recent years, many investors have questioned the need to invest in areas of the equity markets beyond US large-cap companies. As noted in previous quarters, a significant portion of equity returns globally have been driven by a small number of large US companies. It is too early to tell if the tide is turning, but investors are finally seeing higher returns swing back to segments outside of US large-cap stocks. In the third quarter of this year, US small-cap equities, as measured by the S&P 600, gained 10.1%, outperforming US large-cap S&P 500, which rose 5.9%.
There are a few possible drivers behind this shift. One explanation is that the rally in mega-cap US equities may have been overextended, fueled by the hype surrounding artificial intelligence, which drove recent outperformance. Another possibility is that larger companies with little to no corporate debt were less affected by rising interest rates than smaller ones. Now that we are officially in an interest rate-cutting cycle, investors may see the rally broaden, driven by higher expectations for earnings growth from US small-cap companies and international markets.
It’s important to recognize that different factors drive short-term and long-term equity valuations. In the short term, equity returns are shaped by changes in market valuations, as shifts in investor expectations about future earnings cause indices to fluctuate. In contrast, long-term equity returns are driven by corporate earnings growth, with sustained earnings typically leading equity returns in the same direction.
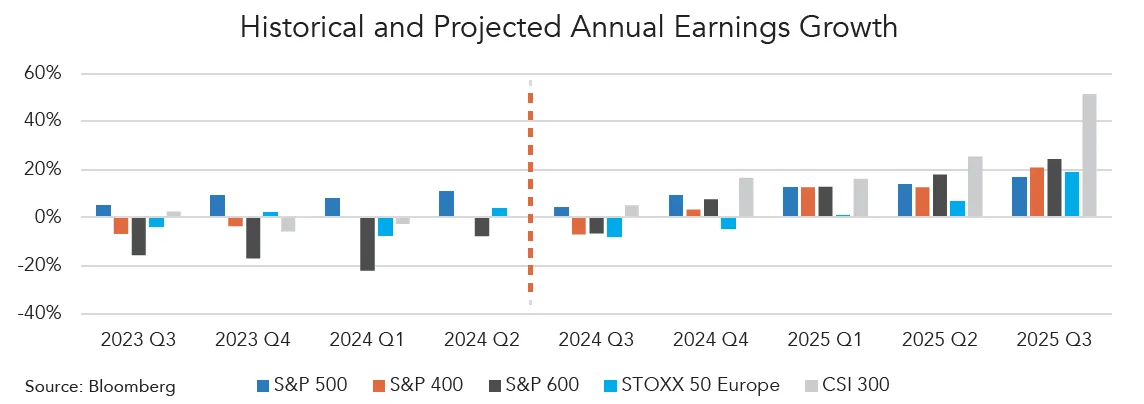
The chart below helps highlight the divergence in corporate earnings between US large-cap companies and other segments of the equity markets. Each bar represents year-over-year (YoY) corporate earnings growth at the index level, showing historical results from Q3 2023 to Q2 2024 and projected results from 5 Q3 2024 to Q3 2025. Note that the 2024 Q3 results are reported during calendar Q4. The outlier for the historical quarters was the S&P 500, which continued to post positive earnings growth in the face of higher interest rates. The other equity indices highlighted, S&P 400 (US mid cap), S&P 600 (US small cap), STOXX 50 (European large cap), and CSI 300 (China Shanghai Shenzhen Index) remained mostly flat or negative in terms of earnings growth. As we look ahead to 2025, trends are expected to shift. While it’s too early to determine if these changes will materialize, we could be in the early stages of a broadening rally across equity markets.

Over the past 20-plus years, the reemergence of the Chinese economy has been a major driver of global economic growth. Investors in Chinese equities have benefited from strong returns for most of that period. However, this trend began to change in recent years as China’s economic growth slowed.
In early 2021, the Chinese Communist Party (CCP) introduced a new initiative called “Common Prosperity” to promote social and economic equality within the country. This policy had the most significant impact on the real estate sector, but its effects were also felt in other areas, such as healthcare, private education, and online gaming. The uncertainty of which companies may be affected next by the initiative contributed to lower investor sentiment and equity prices.
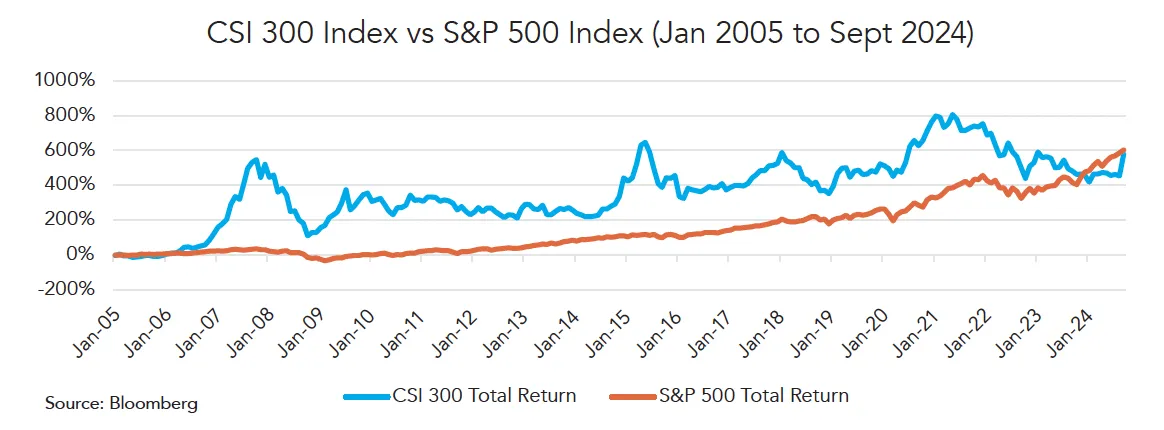
Throughout 2024, various stimulus measures were announced to boost the local economy, but most failed to penetrate the Chinese equity markets. However, at the end of September, a new wave of stimulus was announced to stabilize the local housing market and provide an economic boost. As a result, Chinese equities experienced a significant rally, with the Shanghai Shenzhen CSI 300 Index up more than 25% in the last five trading days of September.
While it is too early to determine if the rally is justified, given the recent stimulus measures, investors appear to be positioning themselves for a potential recovery after a few years of negative returns. The chart below highlights the performance of the Shanghai Shenzhen CSI 300 Index compared to the S&P 500 Index since January 2005. In recent years, the S&P 500 moved in a different direction than the CSI 300 Index, but the recent performance boost in China has partially closed the gap between the two.

The Federal Reserve (Fed) embarks on its first easing cycle since the pandemic shock in March 2020.
Interest rates are being reduced due to expectations of lower inflation and a more balanced labor market, potentially creating opportunities for bond investors.
The Federal Open Market Committee met in September and elected to reduce the overnight Fed Funds rate from the previous range of 5.25–5.50% to 4.75%–5.00%. The committee also published the quarterly Summary of Economic Projections, penciling in another 0.50% of cuts for the remainder of 2024 and 1.00% for 2025, bringing the terminal rate to approximately 3.00% by 2026.
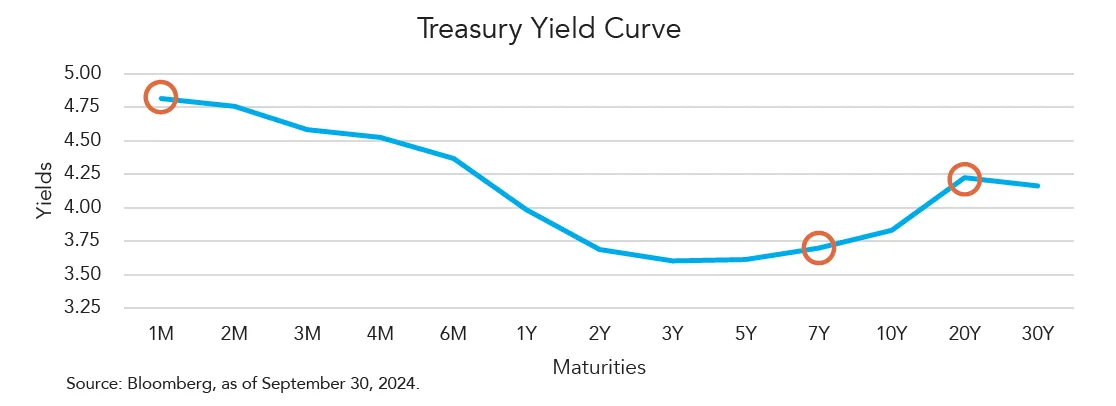
This change suggests that money market investors can expect lower yields in the coming year. Fortunately, our portfolio management team anticipated this movement and employed a “barbell” rate strategy. A barbell strategy allows us to hedge against different interest rate scenarios. By concentrating credit risk on shorter-term bonds, we maintain flexibility in case rates stay elevated, while longer-term treasuries are positioned to benefit if rates fall more quickly.
We can use the chart below to see how a simple portfolio split 50/50 between money market and the 20-year treasury bond produces an overall yield of 4.50%, compared to the 3.70% yield on the 7-year note or the 3.80% yield on the 10-year note, while maintaining a similar level of interest rate risk to the 7-year note. Instead of traditional money market funds, we employed AAA-rated Collateralized Loan Obligations (CLOs) in the short-term portion of the portfolio. While CLOs carry slightly higher risk, they offer enhanced yields due to their floating-rate structure, which adjusts with interest rate changes.
The recent drop in rates has led to some segments of the fixed income market becoming more attractively priced due to wider yield spreads. This is particularly true for the tax-exempt municipal bond space.
Since the Fed began raising rates in March 2022, municipal bond spreads, on a taxable equivalent basis, have become more expensive relative to treasuries. As of March of this year, 10-year treasury yields provided a tax-adjusted yield advantage of around 0.20% over a tax-exempt municipal bond with a similar maturity profile.

Tax-exempt municipal bonds are particularly attractive to investors in higher tax brackets because their yields, when adjusted for tax savings, can outperform taxable bonds like treasuries. Essentially, investors in higher tax brackets can achieve similar or better returns while enjoying the tax benefits of municipal bonds.
The tables below show this. The first table transposes the taxable equivalent yields of AAA-rated municipal bonds of varying maturities to treasuries, for each of the marginal tax brackets. As we see, a taxable investor in the 35% tax bracket would need to go out to the 10-year area of the curve to find value, while a 37% marginal tax bracket investor can find value across the curve in municipal credit.
Similarly, for investors willing to move down the credit curve from AAA to A-rated credit, there is value to be found in the 32% tax bracket and even in the 24% tax bracket for maturities over ten years. This represents an improvement over the past two years, when treasuries outperformed tax-exempt bonds for almost all marginal tax rates, making them an asset class worth considering for taxable investors.

Our team of dedicated professionals are here to support you.