
Market Outlook Newsletter
4th Quarter 2022

By Betsy Pierson, CFA
The market’s roller coaster ride during the third quarter was certainly one of steep inclines and dramatic falls. The S&P 500 ended the quarter at a new low for this bear market after increasing almost 17% from its mid-June low. Interest rates, as represented by the 10-year Treasury, experienced a similar upward trajectory, increasing from a 3% yield at the end of the second quarter to around 3.80% at the end of the third quarter. There may be several reasons for this year’s market action, but the primary reason is the Federal Reserve’s (Fed) aggressive moves to lower inflation.
The Fed has a dual mandate of pursuing the economic goals of maximum employment and price stability and utilizes a variety of policy tools to achieve these mandates. The first mandate of maximum employment is not the issue at this point in the cycle. In reality, it is part of the price stability issue. Tight labor markets, too few employees, and continued demand have led to wage increases. The Fed’s main concern is the higher inflationary environment, not only in the United States but across the globe.
The Fed has undertaken the most aggressive interest rate hikes in modern history. Since March, the short-term rate set by the Fed has increased by 300 basis points (3%). At the most recent meeting, the Fed’s outlook indicated that there will be an additional 125 basis points (1.25%) increase before year-end with rates then stabilizing in 2023.
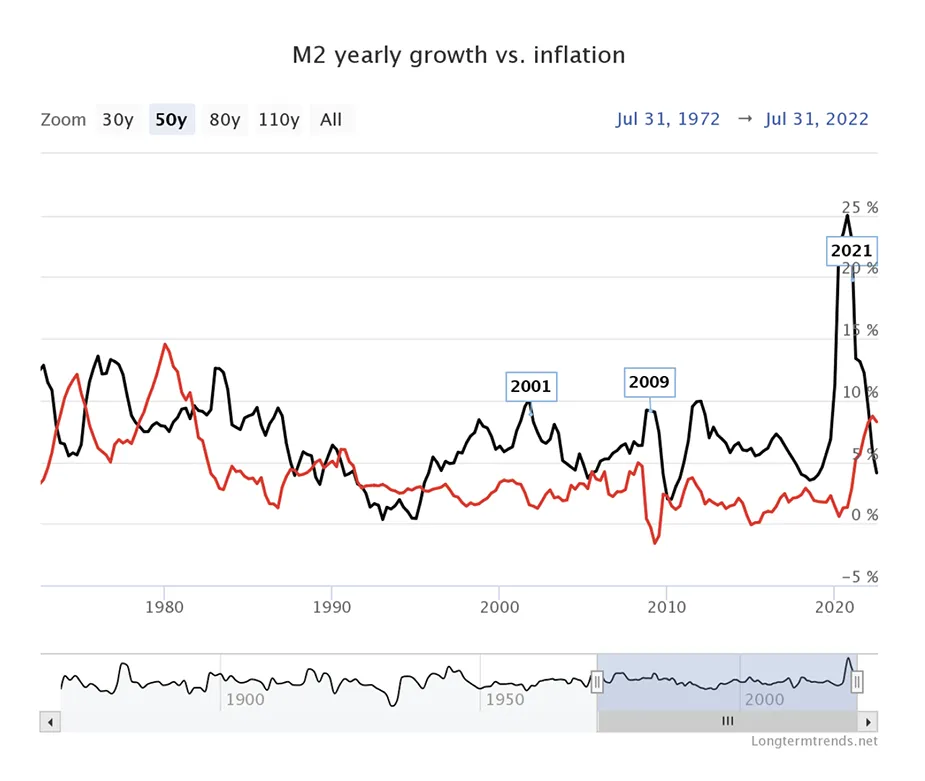
Strong demand in housing and labor has driven inflation higher through pricing power and limited supply, as well as excess liquidity measured by the growth in money supply. This spike was created by fiscal and monetary stimulus programs during the pandemic. The strength in housing, labor, and the excess liquidity have led to inflationary pressures not seen since the 1970s. We have discussed before that these three things are not the only triggers for higher inflation, but they are the ones the Fed can attempt to control with monetary policy. By aggressively raising rates and therefore tightening monetary policy, these three items should respond accordingly and lower the inflationary pressures.
The increase in interest rates has influenced the housing market by higher mortgage rates, making housing less affordable. Pricing pressures, supply issues, and overall demand have begun to decline. Home prices, as represented by Case-Shiller, had the largest month-over-month decline in July since December 2011, and mortgage rates have increased to nearly 7% leading to more pressure on housing. The National Association of Home Builders (NAHB) Housing Market Index has fallen the last nine months and stands at the lowest level since May 2020. An additional component of housing inflation is rental prices. The month-over-month change in the National Rent Index appears to have rolled over and begun to decline during the last month. Rents were fairly flat to declining in 2020 due to the moratorium on rental evictions and lowered housing inflation. Once the moratorium lifted, rents spiked in 2021 and early 2022. While the peak in rental prices may be in, year-over-year rental prices will continue to increase housing inflation. The money supply growth has definitely rolled over from its high (almost 27%) in late 2021 to the current level of 4.11%. Money supply growth leads inflation. The dramatic decline in the rate of money supply growth should also lead to inflation rolling over. The impact on labor and employment is not as evident yet. Employment is a lagging indicator and typically does not roll over until the economy has dramatically slowed down or moved into a recession. While there have not been any economic releases that demonstrate slowing, there have been announcements by the largest technology companies that they are cutting costs and staff. This is the first sign of the impact of the aggressive moves by the Fed in the labor market.
Historically, it has taken approximately three to six months for the impact of a tightening action to show in the economy. We are only six months into this cycle, and the economy is just now seeing the impact of the first 75 basis point (0.75%) increases in March and May. Since then, there has been an additional 225 basis point increase, and the impact still needs to work through the system. When asked, Chair Powell stated, “that the mandate to lower inflation to 2% is the main objective and they will continue to be aggressive even if it means the economy moves into a recession.” If the Fed continues this aggressive track, the risk of recession, and a deeper recession, increases for 2023 – if the economy is not already there. The economic landscape has already slowed from post-pandemic levels in the United States and worldwide. The aggressive increase in domestic interest rates has led to a strong dollar negatively impacting earnings for corporations with international exposure. Commodity prices have rolled over as global economies slowed and the dollar strengthened. Taking all of this into consideration, it may behoove the Fed to slow down the pace of hikes and monitor where the economy and inflation go over the next three months. The Fed has been criticized for waiting too long to begin this tightening cycle. It is now afraid of being wrong and repeating the 1970s and appears willing to err on the side of risking recession.
Looking into the next quarter, unless the Fed pivots, or slows, or pauses its projected moves, the markets may continue to be volatile and subject to lower levels. The “don’t fight the Fed” advice works in both directions. This certainly has held true this year, and future market moves will depend on Fed action. Bear markets are never a pleasant experience. However, they do come to an end, and long-term investors will reap the rewards for staying the course. It is almost impossible to time a market. To do it, you need to make two decisions: when to sell and when to buy back in. It is quite challenging to time both of those accurately.
It is beneficial for investors to take a step back during these volatile times and remind themselves of their long-term goals. Investing in a suitable investment allocation is the long-term driver of returns, and a diversified

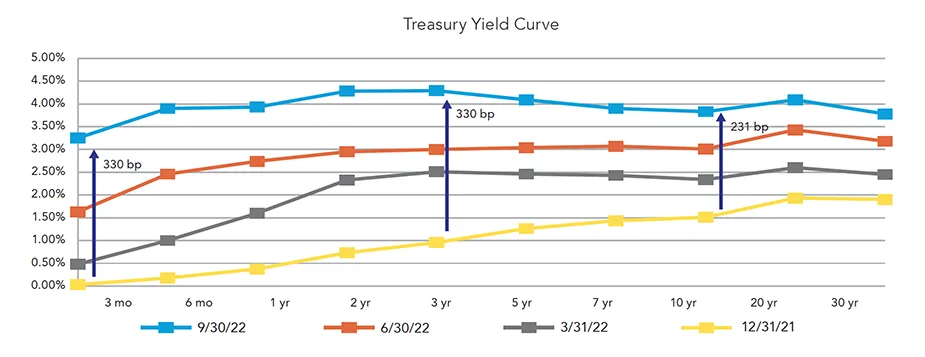
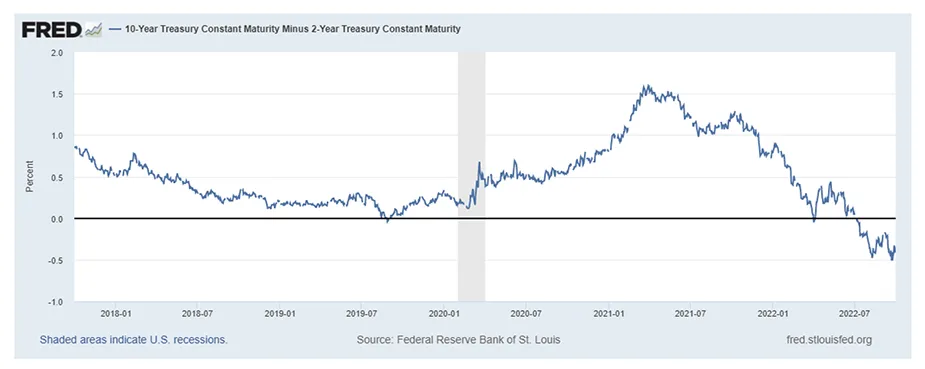
The yield curve can be confusing when it comes to discussions about how it affects prices and what it means based on its shape. Many investors wonder what it means when the yield curve is upward-sloping or downward-sloping. Given the conditions of current yields, here are some points that discuss where the yield curve is at and what an inverted curve means:
Another indicator of economic health is credit spreads. During the last quarter, credit spreads have remained relatively unchanged. During times of economic uncertainty, credit spreads tend to widen.
With what seems to be a wave of red across all asset classes this year, Consumer Sentiment is at multi-decade lows, equities are in bear market territory, and to top it off, fixed income performance has not been any better. The Fed’s relentless approach to controlling inflation has sent shocks across the market. Many who were once hopeful of not having a recession are feeling the weight of economic data. This year, fixed income performance has been as follows:
For the past several years, lower interest rates have left yields depressed. Articles often talked about the death of the 60/40 portfolio and how to change the ways investors looked at fixed income. However, with the recent interest rate changes, fixed income has become more and more attractive.

By Chris LaPorta, CTFA, AFIM and Dan Zeigler, CFP®, CMFC®
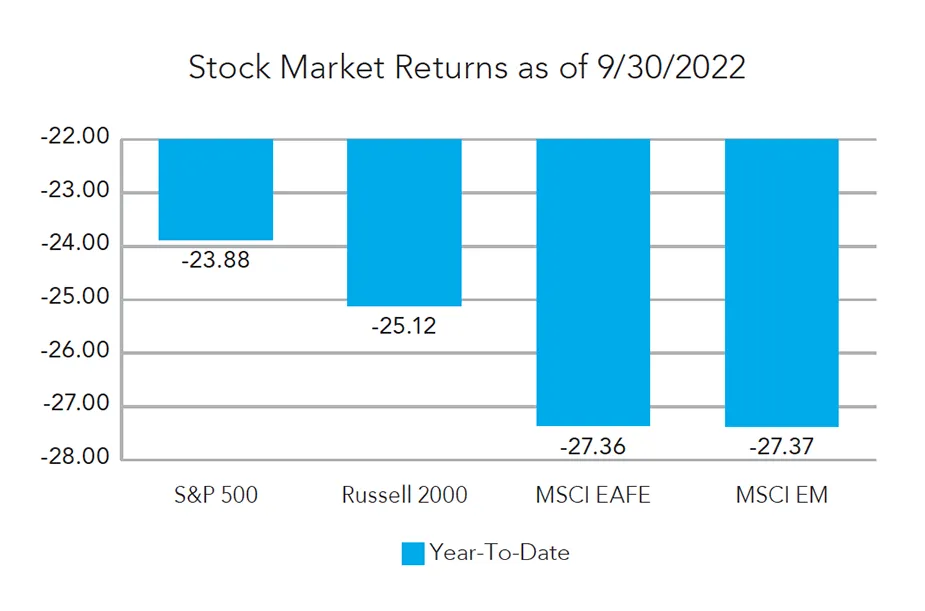
It’s been quite a ride on Wall Street as another volatile quarter ends for stocks. The S&P 500 has now fallen for three consecutive quarters, led by its third weekly fall in September, one of the most volatile months of the year. The equity markets appeared to have hit a bottom in mid-June, as the S&P 500 rallied 17% from the June lows. However, investors had other plans. The index is back to retesting those lows in the last week of the third quarter. The equity market remains in a bear market, with the S&P 500 down ~24% for the year. Investors continue to price in stubbornly high inflation, which is pushing the Fed to rapidly lift interest rates as it tries to cool down the economy. The equity market is searching for any evidence that the threat from inflation is receding.
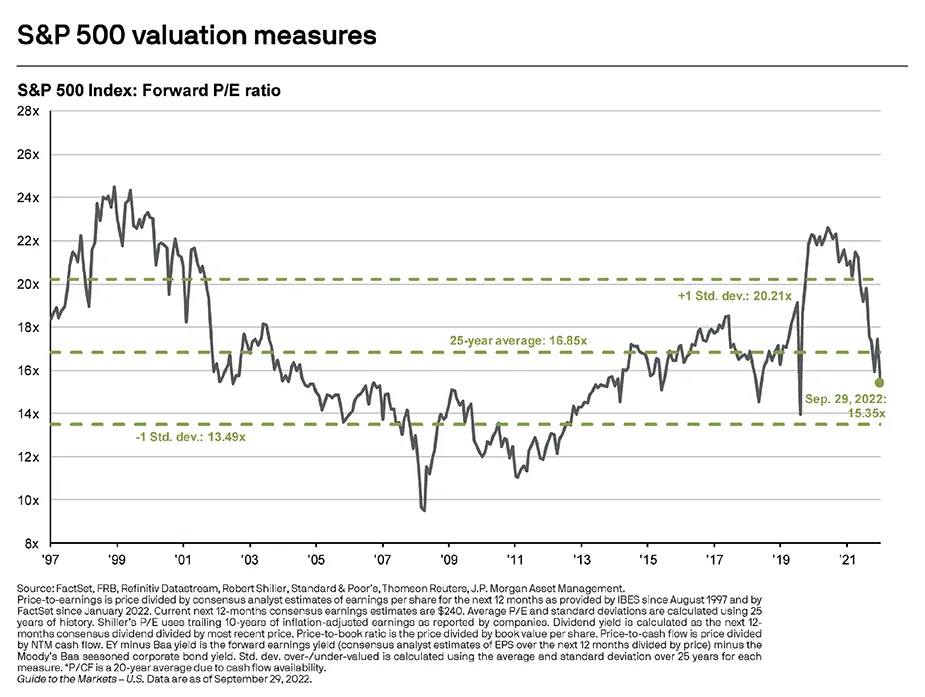
With the recent decline in equities, stock valuations have now dropped below their historic averages. All eyes will be on the upcoming earnings season to see how corporations are faring with the economic slowdown, higher inflation, and higher interest rates. For the third quarter, the market is still expecting a slower earnings growth rate of 3.2%, which would mark the lowest earnings growth rate since the third quarter of 2020. The recent strength of the U.S. dollar will also weigh heavily on multinational companies’ profit margins, as they convert their earnings overseas back into a high dollar.
As hard as it may be to stay positive and continue to hold equities, it is important to remind everyone that we have been through bear markets in the past. Historically, the market has recovered from every bear market and gone on to set new highs. The average bear market typically lasts around 20 months, and on average, the equity market declines around 30-40%. To put today’s market in perspective, we have been in a bear market for most of the year, and the S&P 500 is down close to 24%. It is impossible to time the bottom and top in equity markets, as they lead the economic cycle by six to seven months on the way down and again on the way up. When investors get the all-clear sign, the market has already looked past the bad news and into the future.
Another key element leading to some of this year’s volatility is the unknowns of the upcoming mid-term elections in November. Historically, in a mid-term election year, equity markets decline in the first three quarters of the year and then begin to rally leading into the final few weeks before the election. In fact, market returns after a mid-term election have been strong, averaging around 15% for the next 12 months. Of course, each cycle is different, and investors will need to continue to weigh the impacts of inflation, higher interest rates, recession worries, and geopolitical concerns.
While there is always a level of uncertainty regarding the markets and economy, several events over the last two years have increased the uncertainty we are currently experiencing. Although there is an important distinction between risk and uncertainty, for uncertainty exists when we cannot determine the chances of something happening. Many investors often confuse these concepts. When economic conditions are good and investor sentiment is high, individuals tend to view equity investing as risk-only, where the odds can be calculated. This often leads to overconfidence bias, something that we all experience. When this happens, overconfidence can drive up equity prices and drive down the equity risk premium (expected level of return for accepting a certain level of risk above the risk-free rate). During this time, individuals tend to be over-allocated to equities and are often willing to accept a higher degree of risk than their typical comfort level. However, during times of crisis, an investor’s view about equities changes from one of calculated risk to one of uncertainty. We will hear the media and read articles that suggest “things could get worse.” When the markets begin to appear uncertain to investors, the risk premium expected for equity rises. This is what can lead to negative investor sentiment and big drawdowns in the equity markets.
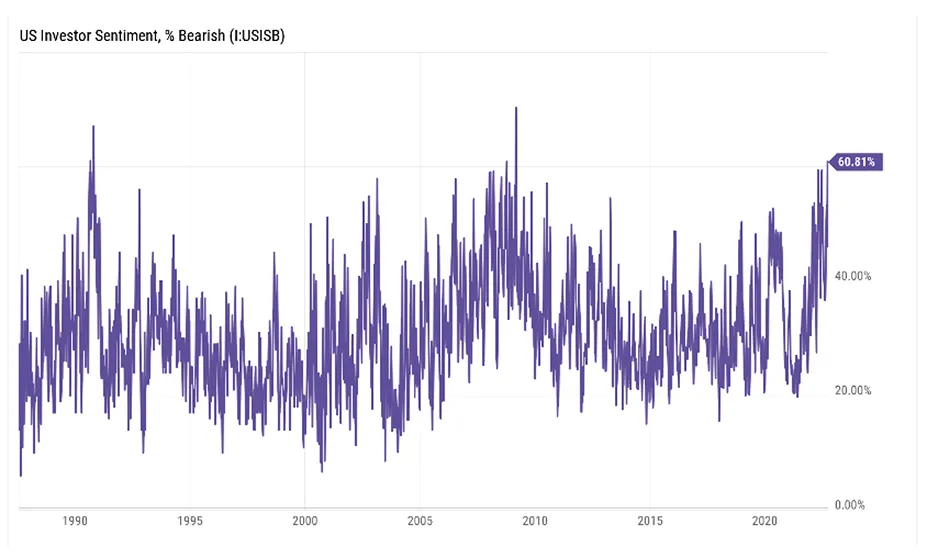
Both uncertainty and risk are different from investor sentiment. Investor or market sentiment refers to how investors feel towards the markets. There is a sense of herd mentality, and that is revealed through volatile buying and selling activity in the markets. Referencing the chart on the next page, the highest percentage of AAII bearish sentiment was 70% on March 5, 2009, which was almost at the end of the financial crisis. Right now, we are at a 60% reading. Does that mean that we are at or near the bottom? Not necessarily, but if we look closely at the data, we could be. For part of 2021 and all of 2022, the stock market has been pricing in higher inflation, ongoing interest rate hikes, rising unemployment, a housing crash, and much more. Maybe things can get worse or maybe we have seen the worst already, but when we have a longterm investment objective, guessing when the bottom might occur won’t make a difference.
It is important to remind ourselves that investing in equities is about uncertainty, not risk. Recently, the equity risk has been so high that investors require a large risk premium for taking gambles. Those investors who have a plan and are working with a team of advisors to help them navigate market volatility can avoid accepting more risk than they have the ability, willingness, or need to take. This will give investors the greatest chance of staying the course and meeting their short-, mid-, and long-term goals. Having a well-thought-out plan will help remove the emotional pull that volatile markets can have on an investor. As we continue to try to navigate down markets, rebalancing and seeking opportunities that are in line with an investor’s risk profile can be an important part of the process. It is also a good reminder that markets are cyclical and for this very reason staying in the markets and being well-diversified and disciplined are crucial for keeping strategic goals in mind.

By Edward Avery, JD, CTFA
AARP has reported that 3 out of 4 U.S. adults have experienced or have been targeted by at least one form of fraud. Scams and fraud have soared across the U.S., but reported losses are just the tip of the iceberg. Losses are often not reported because of the shame and blame attached to the victims of fraud. More than 1 in 4 people who reported losing money to Fraud in 2021 said it started on Social Media.
The scams fall into three different types, Investment Scams, Romance/Accident Scams, and Business Scams.
With Investment Scams, make sure to talk over large sum investments offered by telephone salespeople with a trusted friend, family member, or financial advisor. It is never rude to wait and think about an offer. Always take your time making a decision. Legitimate companies won’t pressure you to make a snap decision. No legitimate investment will require upfront money to reap astronomical returns within unrealistic timeframes. If something sounds too good to be true and it’s coming from somebody you don’t know, it’s almost certainly a scam. Be wary of “get rich quick” or “easy money” schemes, especially if unsolicited.
Romance Scams involve interactions over social media. The Love of your life: If an Internet flame asks you for money, it’s almost certainly a scam. Even if they promise to pay you back, you should assume you’ll never see the money again. The Fake Accident scammer convinces senior citizens that a relative or close friend has been in an accident and needs money for treatment. Sometimes the grandparent’s scam is about the scammers gathering information from social media and using it to extract money from their victims. They may imitate a close relative or an official person and say the relative needs funds due to an accident or an arrest for an offense. They then request funds be wired immediately to assist the person that is related to them.
Business Scams use known links to access businesses online. The two companies scammers use most are Amazon and Apple since most people are familiar with these entities and may have accounts with them. Avoid sending money to individuals claiming to be from legitimate businesses asking for payment or offering you an unexpected refund. Do not pay with reloadable cards. Government offices and trustworthy companies do not ask for this. If you make purchases online, do purchase through an HTTPS site, as opposed to HTTP. Unsecured sites have no lock sign or “https” in the address. When doing anything sensitive online, make sure you only provide personal or financial information to a secure site. If not secure, it can be stolen easily. Any reputable bank or online shopping site will require a secure connection.
Remember, Midland States Bank does NOT initiate emails, texts or phone calls seeking your personal data, account, or card numbers.
Always, report instances of fraud and scams to the Consumer Financial Protection Bureau or at ReportFraud.ftc.gov.
Our team of dedicated professionals are here to support you.