
Market Outlook Newsletter 1st Quarter 2024
Despite robust economic data, including historically low unemployment and strong wages, a sense of pessimism permeates many Americans’ outlook on the economy.
The economy has held steady over the past year, with most economic indicators waving green flags. While we remain optimistic about the potential for a soft landing, we still err on the side of caution and maintain a defensive stance as markets bake in the potential for rate cuts over the next two to three years
During the pandemic, many firms felt the woes of ‘quiet quitting,’ that is, employees checking out of their roles and working the bare minimum. Companies then faced the Great Resignation where employees voluntarily left their jobs due to lack of opportunities, benefits, or hybrid status. As we enter 2024, many Americans believe we’re in a ‘silent recession,’ where markets continue to hit highs and employment remains strong, but consumers feel they’re living in an economic downturn. A 2023 LendingClub report showed that nearly 62% of households live paycheck to paycheck. Delinquency rates on credit card loans have jumped nearly 93% since third quarter 2021. While still nowhere near the peaks during the 2008 financial crisis, it certainly does lend to the fact that Americans at some level are struggling. The University of Michigan Consumer Sentiment Index has been flirting with historical lows. For reference, the index bottomed out during the 2008 crisis at 55.3 but mostly hovered in the high 50s. As of late, the index read 61.3, trending downwards. It’s fair to say that high interest rates and persistent inflation have been wearing pocketbooks thin over the last year. However, at the most recent Federal Open Market Committee (FOMC) meeting, the Federal Reserve (Fed) paused its most aggressive rate hikes in recent decades, remarking that inflation has eased over the past year but remains elevated. At this time, it appears that the rate hike cycle is complete. The Fed dot plot projects the potential for three rate cuts this year with more to follow in 2025 and 2026. While rate forecasts can change, we expect the overall fed funds rate and year-over-year inflation to fall in the mid to low 2% range. These coupled financial metrics should give consumers more confidence in our economy while inflation eventually normalizes. Prices may not decrease but will feel more normal, especially with wage increases.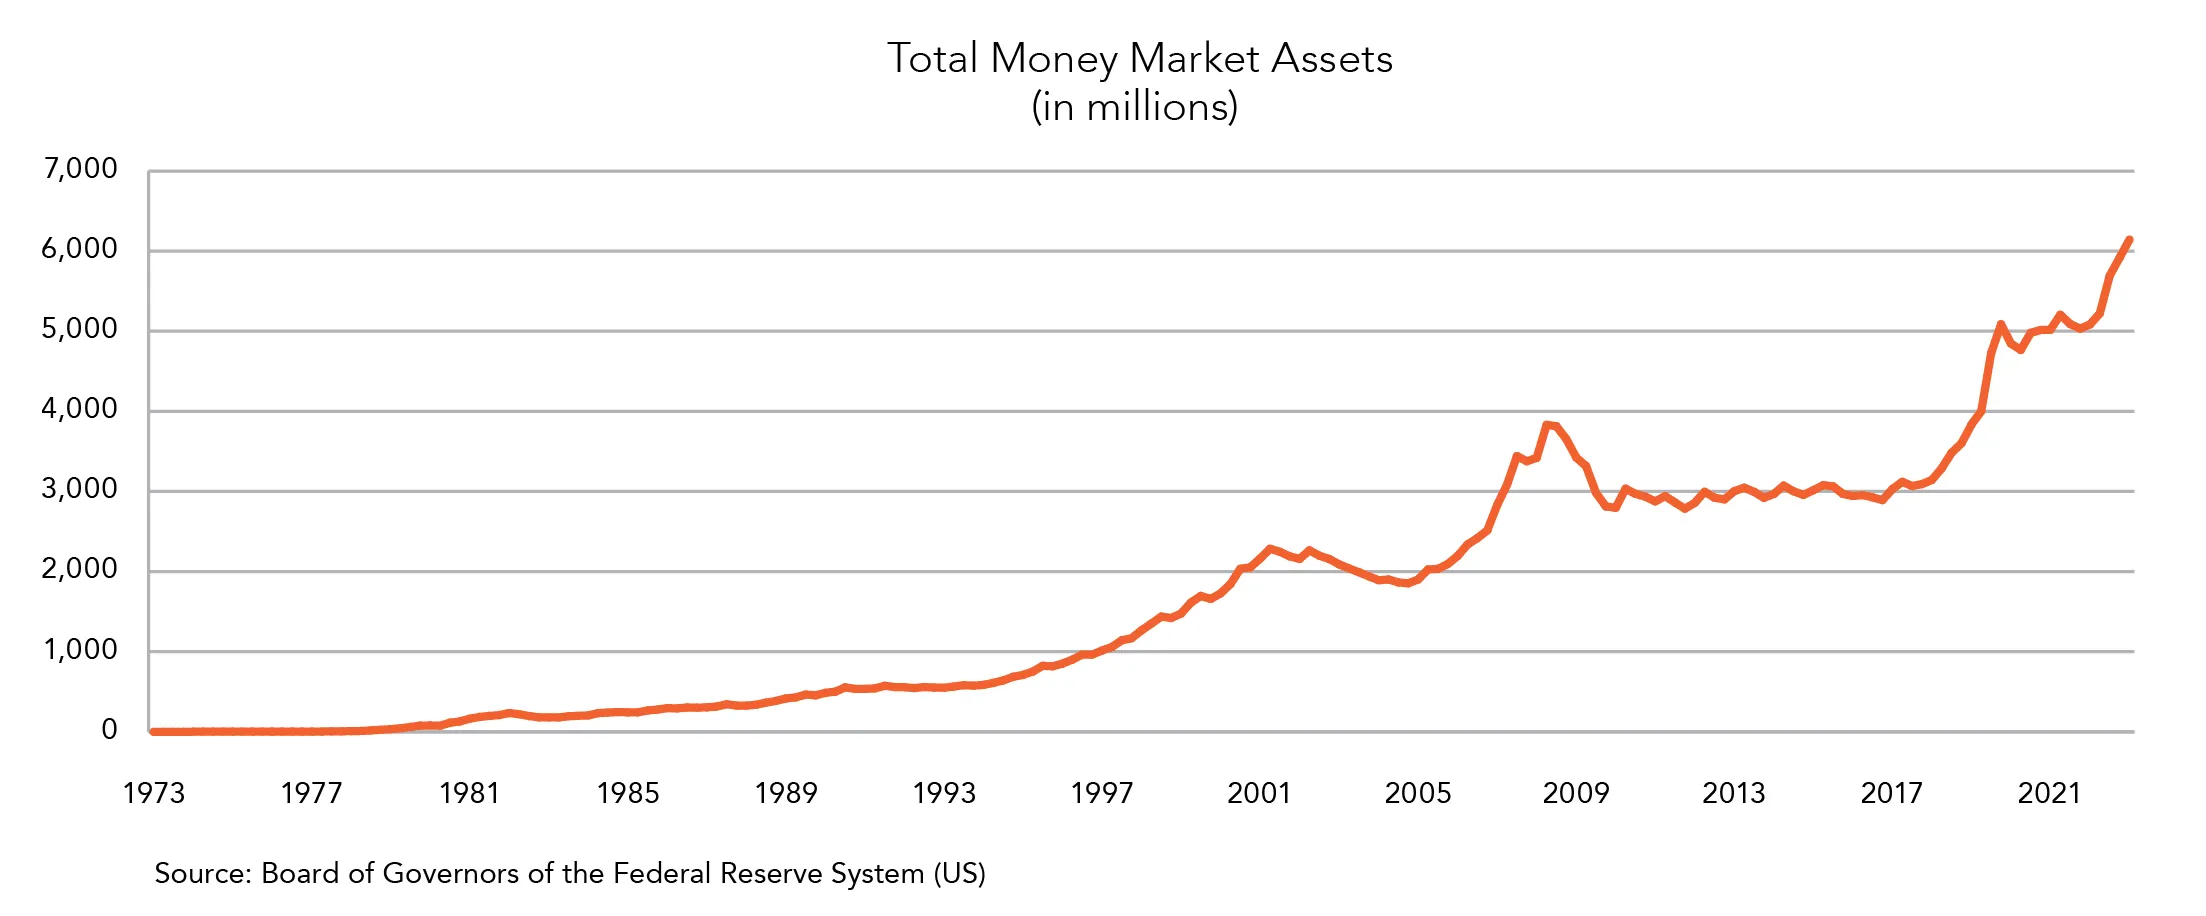
The Fed’s aggressive rate hikes left many investors feeling as if they were between a rock and a hard place. Fixed income asset valuations decreased with the rise of rates, and equities remained volatile as economic uncertainty persisted. Investors sought places to park cash while capturing some income. Money markets became the go-to investment vehicle since the second quarter of 2022. At nearly $6 trillion, total money market fund assets exceed levels during the 2008 crisis by over $2 trillion. With some short-term money market rates well above 5%, these accounts offer investors the perfect place to maintain the time value of their cash and earn a little extra. However, with the potential for interest rate cuts over the next three years, money market rates will likely decrease, leaving investors searching for products with higher returns. This could push some to enter the fixed income and equity markets over the next several quarters. With current elevated rates and company valuations, these create attractive purchase opportunities for investors.
The U.S. labor force takes on significance when evaluating the health of our overall economy. The unemployment rate remains strong and has not surpassed 4.0% in the last 12 months, edging down to 3.7% in December’s most recent data. Average hourly earnings continue to rise month-over-month, as well. So, despite the weight of high interest rates and consumer prices, the employment market remains strong and shows no sign of slowing down.
With inflation continuing to moderate, the Fed is likely done raising interest rates. Investor focus now shifts to when rate cuts may start in 2024.
It appears that inflation continues to move toward the target of 2% set by the Fed. At a recent FOMC meeting, board members indicated we may see some fed funds rate cuts in 2024. Investor focus has shifted from the high interest rates needed to control inflation to when rate cuts may occur to keep economic growth in positive territory. The timing and magnitude of interest rate cuts will likely be the key driver of bond market returns over the next year.
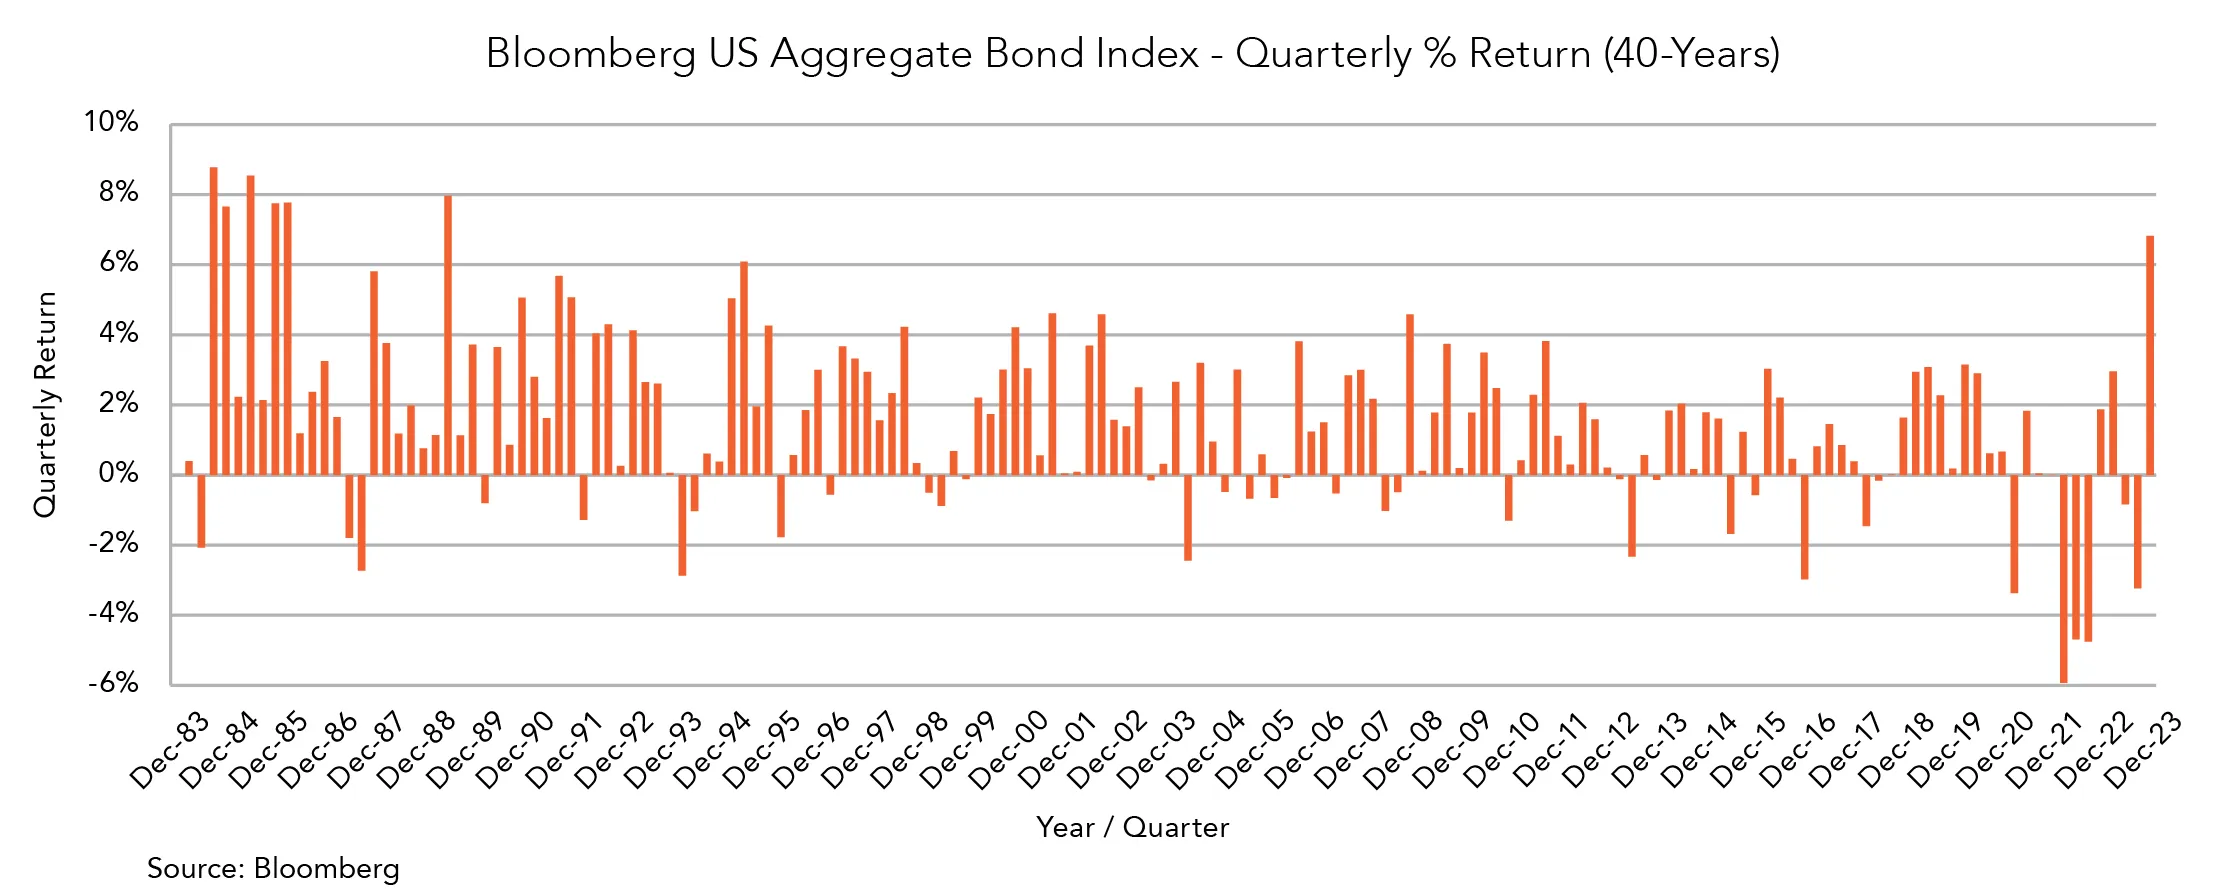
Following a rough two years of bond returns where the Bloomberg US Aggregate Bond Index had negative returns in five of the previous seven calendar quarters, a historic rally occurred in the final quarter of 2023. The index, the primary benchmark used to track returns of investment-grade fixed income assets, posted a 6.8% return to finish the year, the highest quarterly return for the index since the second quarter of 1989 (see chart).
While negative bond returns have been painful in the short term, they remind long-term investors of bond market opportunities we have not seen since the early 2000s. The returns in the fourth quarter were primarily driven by falling long-term U.S. Treasury (UST) rates as the 10-year UST fell from around 5.0% in October to below 3.9% by year-end. Now is a good time for investors to ensure they are not holding too much of their investment balance in cash if current high cash yields fall.
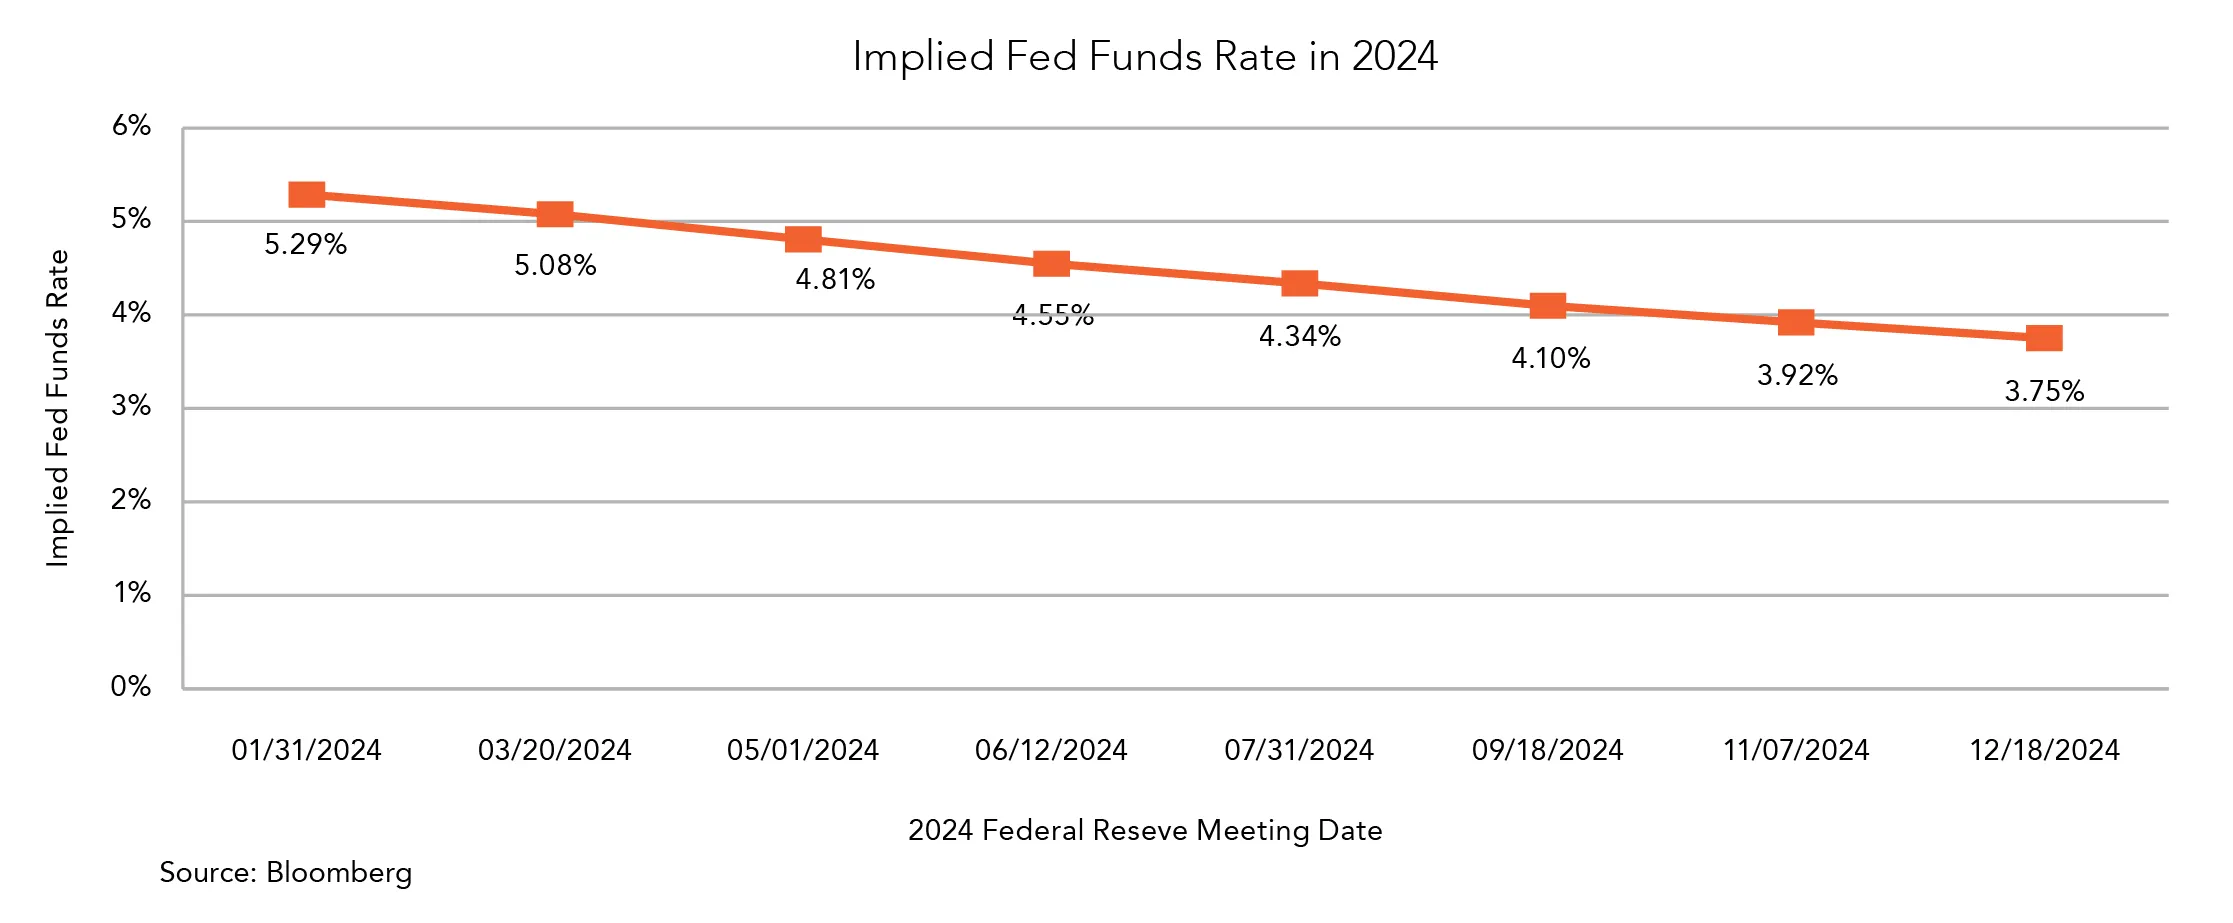
As inflation data continued to trend lower by the end of last year, bond markets priced in higher probabilities of upcoming rate cuts from the Fed. The bond market is positioned for the first rate cut of 0.25% to occur during the March FOMC meeting. This trend is expected to continue with the fed funds rate projected to fall from around 5.3% to 3.75% by year-end (see chart). While this may present an opportunity for the bond market rally to continue, there is a risk that the Fed does not cut rates as fast as investors expect. If this happens, we may see UST yields rise again, halting the recent bond market rally.
Many noticed the 2023 headlines on high mortgage rates. For a part of the year, homebuyers looking to apply for a 30-year mortgage saw rates near 8%, levels not seen in over 20 years. While that high cost of financing makes it difficult for borrowers, it creates an opportunity for investors looking to buy mortgage-backed securities (MBS).
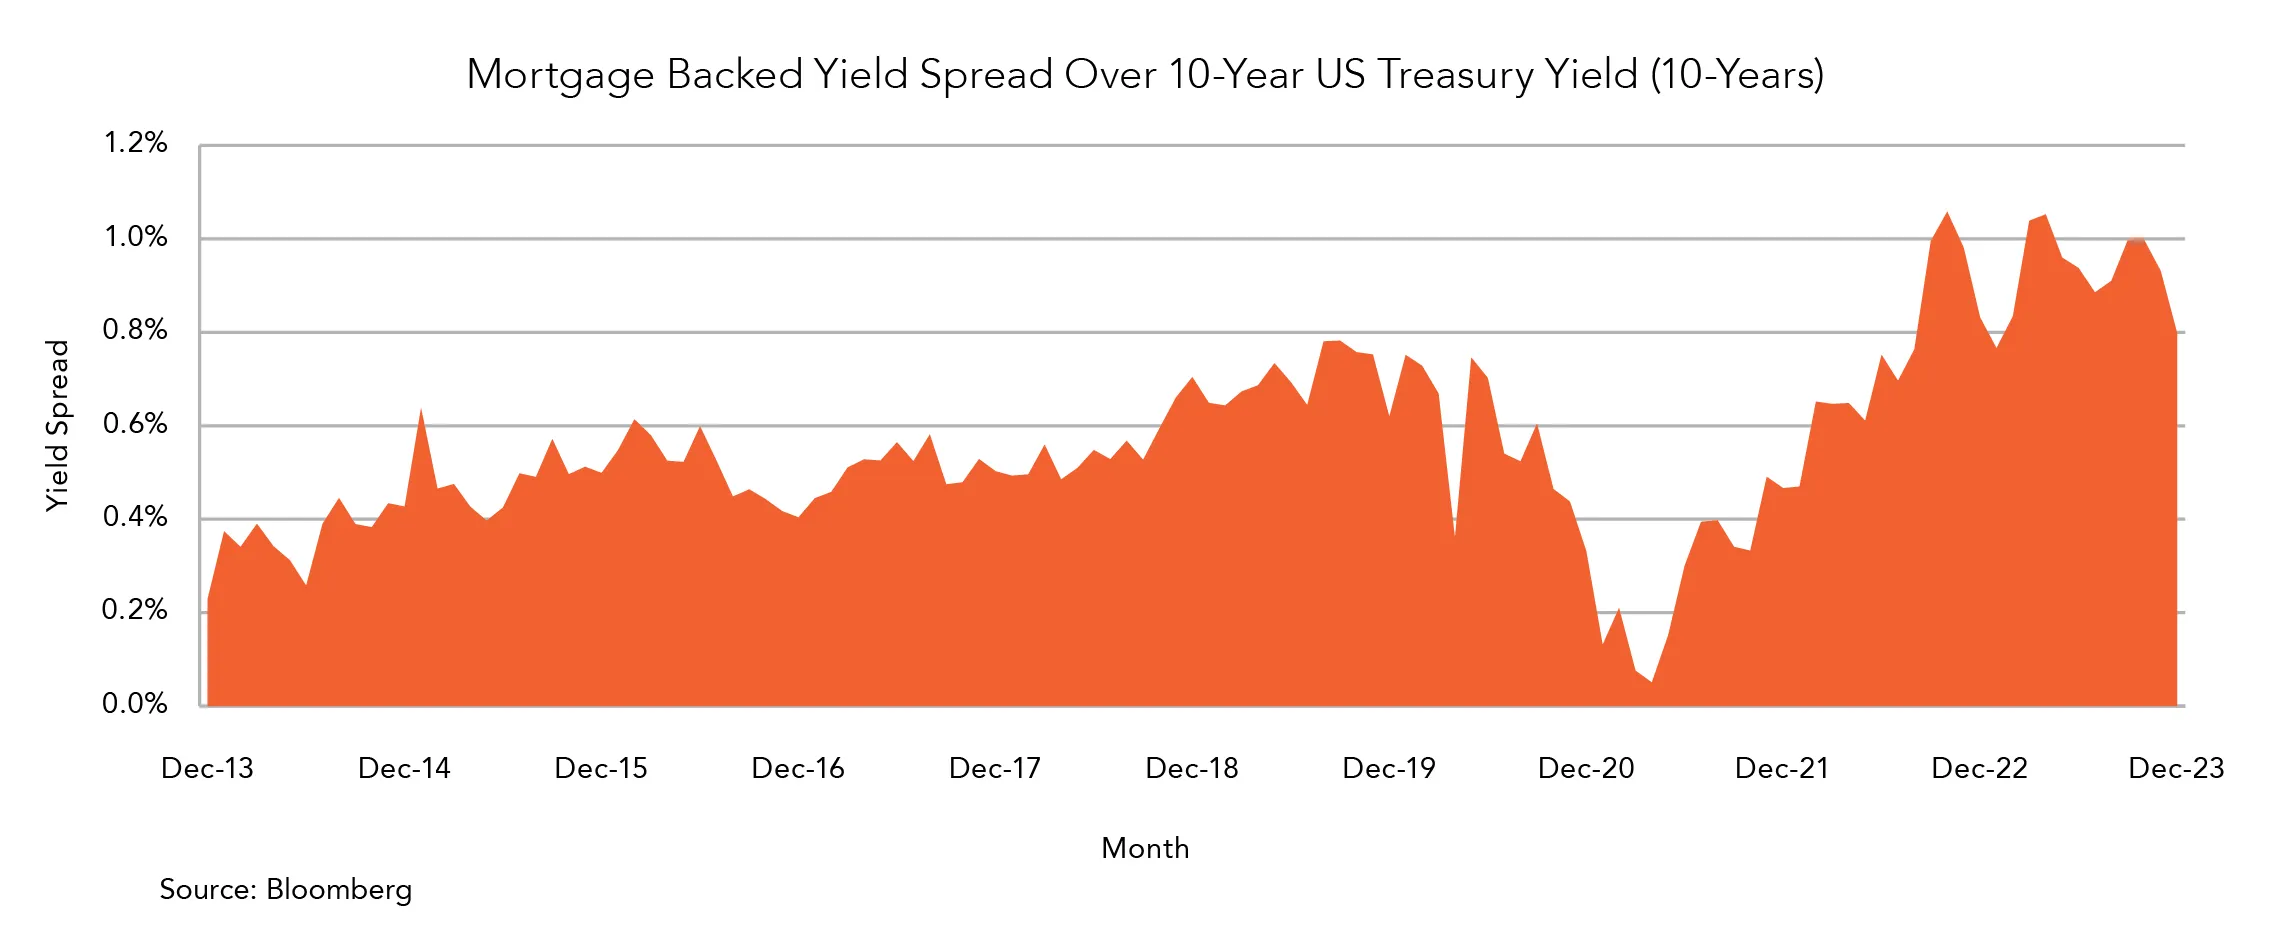
Most MBS assets are government-insured to provide more affordable interest rates for homebuyers in the U.S. Because of this, investors typically see MBS yields close to the yield of the 10-year UST bonds. In 2023, the spread between the yield of MBS assets and the 10-year UST increased to around 1.0%, compared to the typical 0.25% to 0.50% over the past 10 years (see chart).
Our investment team took advantage of this opportunity to add an allocation to MBS assets with less risk than investment-grade corporate bonds but with a similar yield. While we do not see a recession coming in the near term, this helps balance out fixed income exposure within portfolios to have less credit risk in case a recession comes sooner than expected. The goal is to play defense hoping for more attractive opportunities to arise in the bond market.
By Mark Votruba
Expectations for 2024 differ significantly from those just one year ago as the prospect of an unavoidable recession and its negative impact on equity markets have been mitigated – at least for now.
The most well-telegraphed recession of 2023, a result of the most restrictive Fed tightening cycle in decades, never materialized. The likelihood of an economic soft landing was seen as nearly impossible but appears to be where we find ourselves currently. Inflationary indicators continue to decelerate, Treasury yields have moved off their October highs, and the FOMC has appeared to pivot to a dovish posture, leaving the U.S. economy better positioned than anticipated 12 months prior. This sets up what we view as a favorable backdrop for equity markets as we begin the new year, with a portion of that optimism currently priced in following the recent fall market rally.
Unusual conditions born from the pandemic have produced some unusual market dynamics as well. Few anticipated the generative Artificial Intelligence (AI) theme to have such an outside positive impact on market returns through the first half of 2023. The ‘Magnificent Seven,’ coined by the street, represent seven of the top 10 market cap weighted constituents of the S&P 500 and those at the forefront of sectors such as AI. While the market produced a healthy 26% return for 2023, it is important to highlight that the top 10 holdings of the S&P 500 were responsible for 86% of that return, with the remaining 490 plus names accounting for the remaining 14%. As we enter the new year, valuations appear rich by historical standards with the forward price to earnings (P/E) ratio of the S&P 500 trading at a premium to its long-term average. The P/E multiples of the top 10 holdings are even further elevated to the broad market, leaving expectations of further upside potential from current levels somewhat limited.
Current economic conditions and the resumption of corporate earnings growth should positively impact equity markets. However, the potential for market volatility remains as we embark on what should be an interesting year ahead. We positioned our large-cap equity exposure by favoring high-quality stocks. Companies with healthy balance sheets and low leverage supporting solid cash flow returns should be well-suited to navigate the ensuing market landscape. In the past five years, we witnessed the onset of the COVID-19 era, the escalation of war in Ukraine and the Middle East, and the most aggressive monetary policy-tightening campaign in decades. Through this, high-quality equities proved resilient and provided solid returns. As we begin 2024, one thing we know for certain is that we cannot account for the uncertainty of the year ahead.

Midland Wealth Management is a trade name used by Midland States Bank, Midland Trust Company, and Midland Wealth Advisors, LLC, a registered investment adviser. Investments are not insured by the FDIC or any other government agency, are not deposits or obligations of the bank, are not guaranteed by the bank or any federal government agency, and are subject to risks, including the possible loss of principal.
The information provided is for informational purposes only. Information has been obtained from sources believed to be reliable, but its accuracy and interpretation are not guaranteed. Midland Wealth Management does not provide tax or legal advice. Please consult your tax or legal advisors to determine how this information may apply to your own situation. Whether any planned tax result is realized by you depends on the specific facts of your own situation at the time your taxes are prepared. IRS CIRCULAR 230 NOTICE: To the extent that this message or any attachment concerns tax matters, it is not intended to be used and cannot be used by a taxpayer for the purpose of avoiding penalties that may be imposed by law.
Past performance is no guarantee of future results. Returns of the indexes also do not typically reflect the deduction of investment management fees, trading costs or other expenses. It is not possible to invest directly in an index. Indexes are the property of their respective owners, all rights reserved. Midland Wealth Management does not claim that the performance represented is CFA Institute, GIPS, or IMCA compliant.
Copyright © 2024 Midland States Bancorp, Inc. All rights reserved. Midland States Bank® is a registered trademark of Midland States Bancorp, Inc.
Our team of dedicated professionals are here to support you.